Get in touch with Shengtu Bufan Company

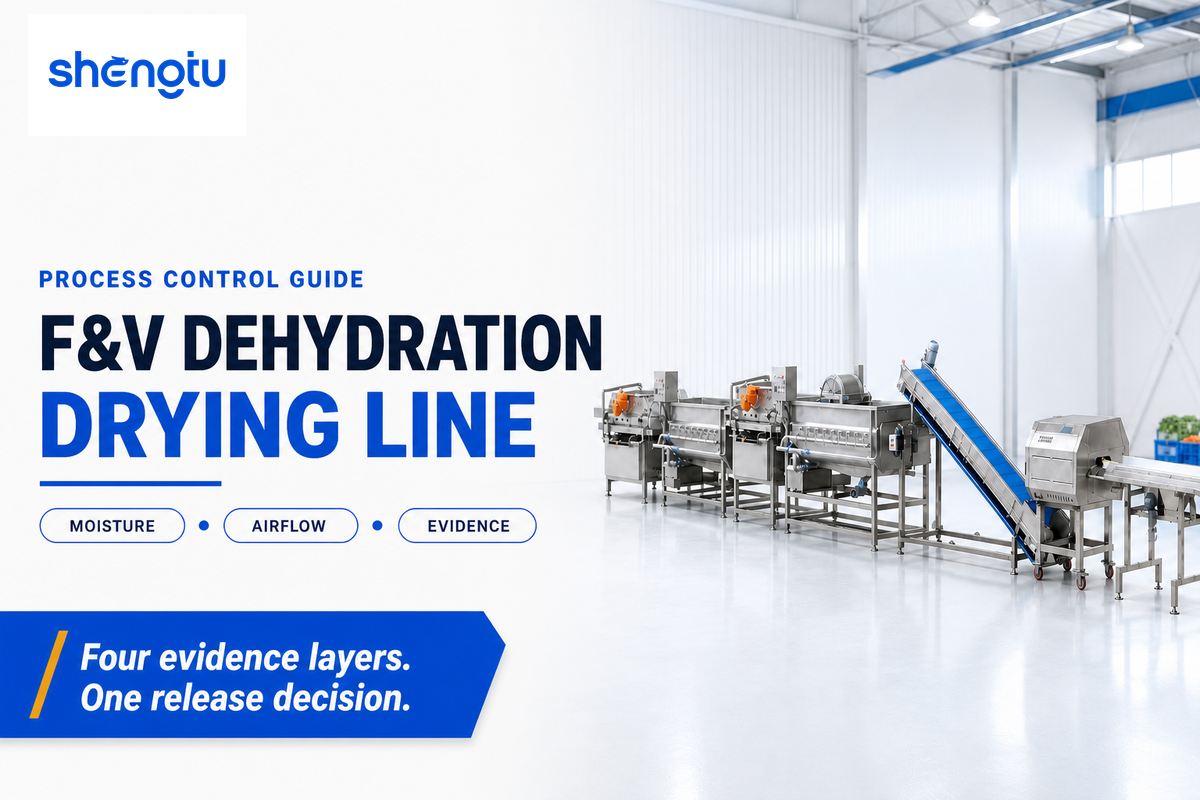
Process Control Guide
F&V Dehydration Drying Line refers to an industrial system that removes internal product moisture through controlled heat and mass transfer. It isn’t the same operation as blowing or spinning surface water from washed produce. Sound process control links air conditions to moisture movement inside each piece, then checks whether the lot is uniform and ready for its intended use.
This guide gives plant managers, process engineers and quality teams a way to read drying curves, pretreatment effects, airflow evidence, case hardening, water activity and release boundaries. It doesn’t prescribe a universal recipe, product-specific critical limit, line capacity or commercial configuration.
By Karry · Evidence reviewed against government, university and peer-reviewed sources accessed in August 2026.
What an F&V Dehydration Drying Line Must Control
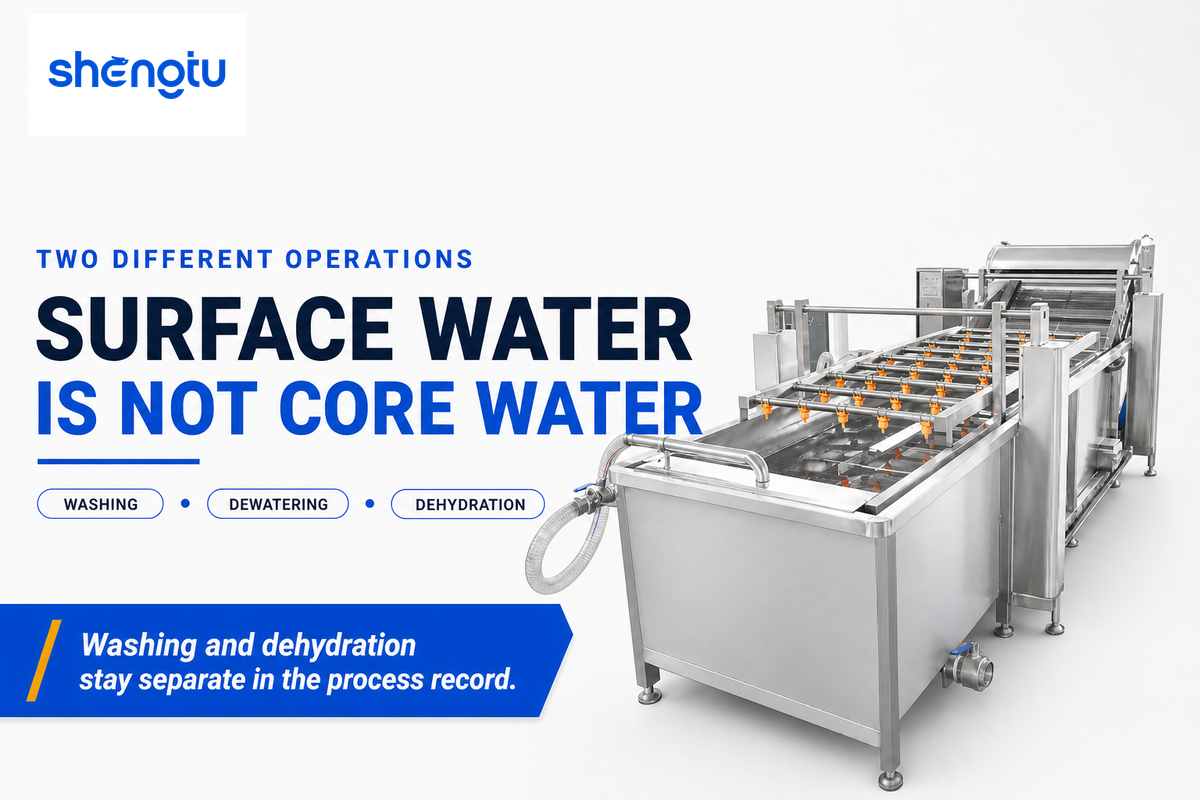
An industrial fruit and vegetable dehydration process controls moisture inside the product, not merely droplets on its surface. Post-wash dewatering prepares fresh-cut produce for freezing, packing or another step. Deep dehydration continues until the product reaches a defined moisture distribution and storage or use condition.
This distinction is more than vocabulary. FDA’s August 2026 fresh-cut produce guidance addresses ready-to-eat fresh-cut produce that is not a low-moisture food. That document also excludes produce that receives added preservation processing from its fresh-cut definition. Its scope does not design a dryer, but it shows why surface-water removal and shelf-stable dehydration need different evidence.
| Decision field | Surface dewatering | Product dehydration |
|---|---|---|
| Water being removed | Free water left by washing | Water held within tissue and pores |
| Main evidence | Surface condition, carryover and downstream handling | Drying curve, internal profile, equilibrated water activity and release controls |
| Typical next step | Fresh packing, freezing or further processing | Cooling, conditioning, verification and moisture-barrier packing |
| Wrong assumption | A dry-looking surface means the core is dry | One average proves the full lot is ready |
Search results often mix a food drying line with upstream washing lines. Within fruits and vegetables processing lines, an industrial vegetable washing stage may use a washing machine, bubble washing, roller washing, high-pressure water, an air knife or a vibrating screen to remove dirt. Those washing systems and vegetable washing line features belong before deep drying. Washing and dehydration should remain separate operations in the process record.
A processor describing an industrial vegetable or commercial vegetable project may use the labels food dehydration, food drying, dehydration processing line, food dryer, dehydrator or dehydrators. The useful specification is not the label. It’s whether the food processing equipment can remove moisture from the intended dried products, control spoilage risk within the plant’s plan and protect the required shelf life.
Industrial food preservation can use a drying process to extend shelf life, but each specific vegetable still needs its own product evidence and release boundary.
Search language is broader than plant acceptance language. Buyers may use vegetable drying, dried fruits and vegetables, or dehydrating fruit and vegetables for the same general topic. A fruit and vegetable dehydration process step by step record must still separate preparation, internal moisture movement and release. The phrase drying and dehydration of fruits and vegetables concept and methods describes an educational scope, while a dehydration of fruits and vegetables project report becomes useful only when it identifies the crop, cut geometry, test method, sampled positions and applicable release rule. A 3 mm cut cannot inherit a 9 mm trial program, and a 0.1 °C sample/headspace difference belongs in the water-activity method rather than in a generic search label.
Shengtu’s broader fruit and vegetable processing methods guide compares preservation routes and the full process sequence. This article stays inside dehydration mechanics and evidence, which prevents it from competing with that broader guide or with the commercial solution Page.
How Water Moves Through Fruit and Vegetable Tissue During Drying
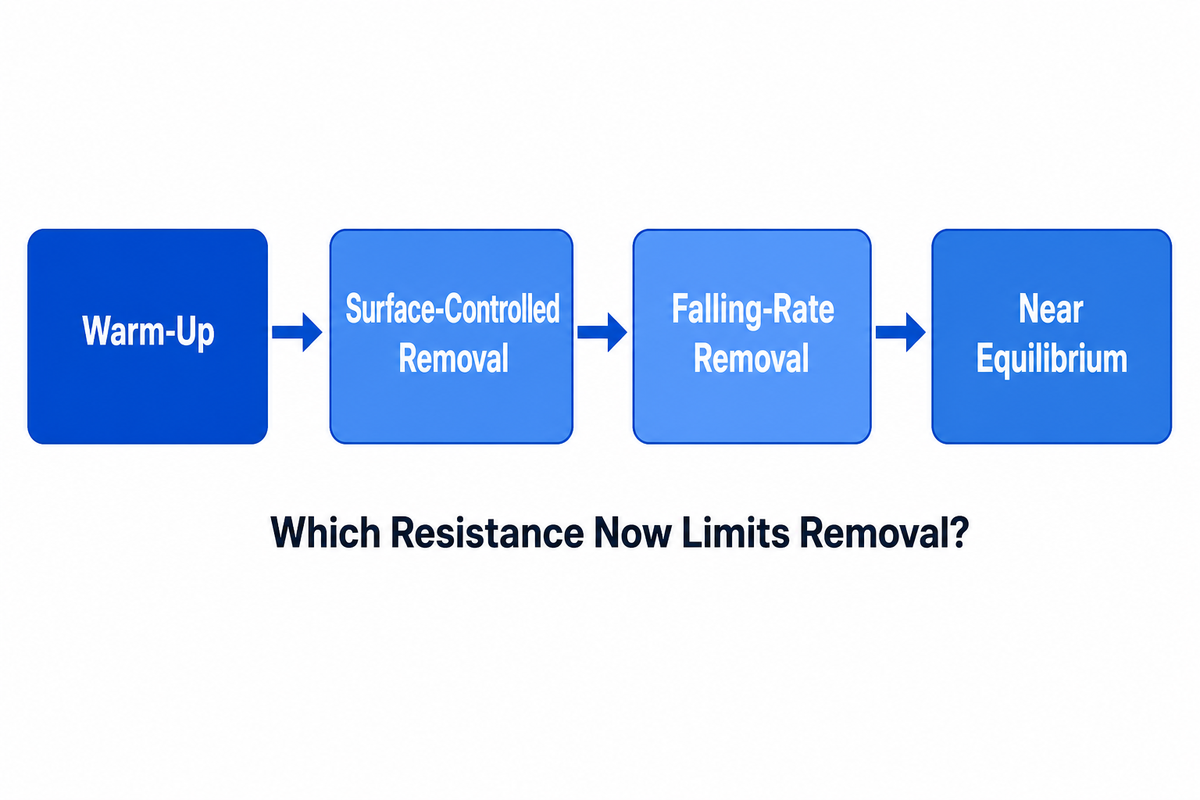
Drying slows while the inlet air remains hot because the controlling resistance moves. Early removal can be governed by heat and mass transfer at the exposed surface. Later, water must travel through a growing dry matrix from the interior, so internal diffusion and binding can limit the rate.
One carrot-cube study describes a constant-rate period controlled mainly by external transfer and a falling-rate period controlled mainly by internal transfer. The later period takes more time because moisture must cross an increasingly resistant path. Real produce may show little or no visible constant-rate interval; a mango study modeled only the falling-rate period after its data showed no constant-rate phase.
Drying-curve reading:
- Warm-up: product temperature trends towards the drying air; little or no loss of water occurs.
- During surface-controlled removal, free surface water evaporates while the air can carry the vapor away.
- Internal moisture movement becomes more resistive than convective movement, creating a longer decline in the drying rate.
- Near equilibrium, the remaining driving force becomes small; extra time can add quality loss without a proportionate moisture change.
Consider two 6 mm pieces exposed to the same inlet temperature. Porous, low-solids tissue can supply water to its surface faster than dense or sugar-rich tissue. The outlet air may look similar at first, yet their cores can diverge later. Timer settings can’t explain that difference; periodic mass, profile or representative-product measurements can.
Falling-rate removal is also where a plant may waste energy by continuing the same air condition after the product response has changed. The useful control question isn’t “How hot is the inlet?” It’s “Which resistance now limits removal, and which measurement proves it?”
Published pineapple modeling separates diffusion from the interior to the surface and convection from the surface to the air. Geometry and shrinkage were included because the transfer path changes as a slice deforms. Equal air temperatures therefore don’t create equal moisture paths across crops or cuts.
Pretreatment Changes the Drying Curve Before the Dryer Starts
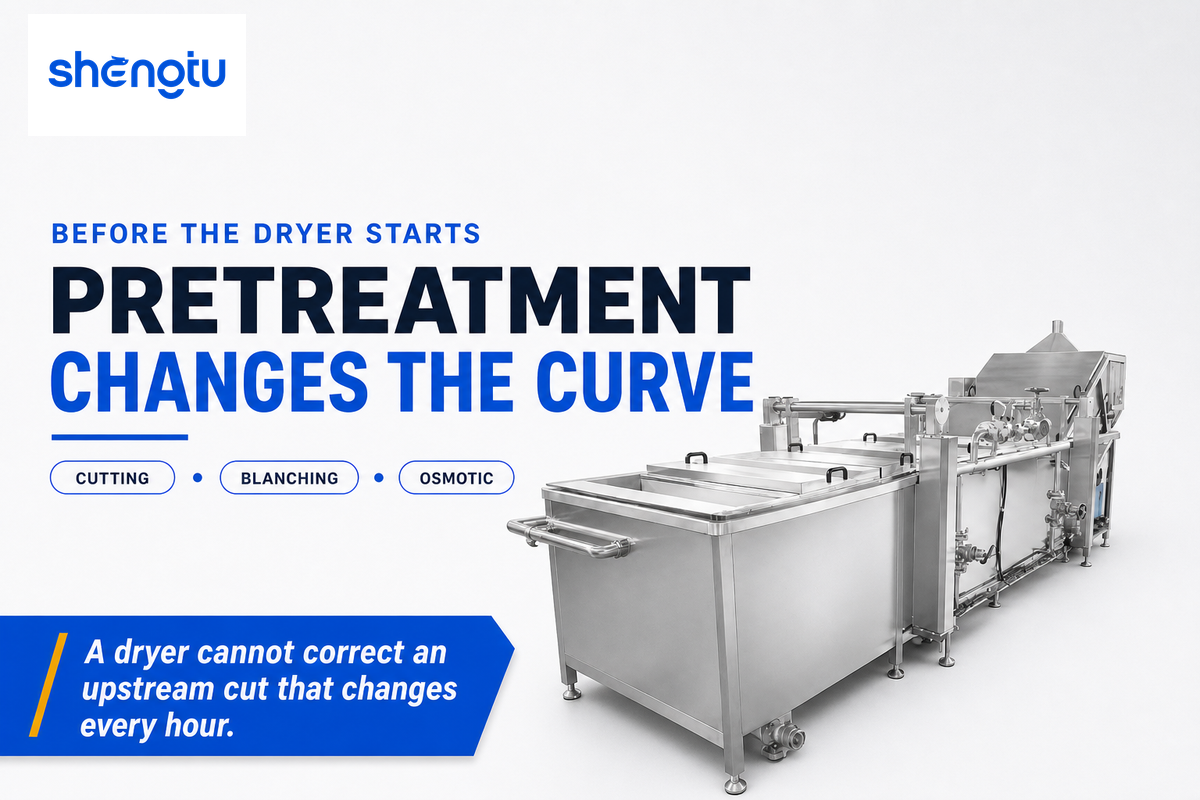
Pretreatment can alter tissue permeability, enzyme activity, surface area, soluble solids and the water that reaches the dryer. Cutting, blanching or osmotic treatment may shorten one part of the curve or protect a quality attribute, yet each treatment can also create damage or add a new source of variation.
Dryers can’t correct an upstream cut that changes every hour. Changing from 3 mm to 9 mm triples the diffusion path before any air setting is changed. Uneven peel removal, bruising, blanching intensity or drain time can make one zone appear to have an airflow fault when its feed arrived in a different state.
One mango experiment compared 3, 6 and 9 mm slices across several drying methods. Time to the study’s moisture endpoint ranged from 3 to 20 h. Lemon-juice pretreatment didn’t improve the drying rate and produced a quality penalty in that design. The result is valuable because it rejects the idea that every pretreatment is beneficial.
Current pretreatment reviews describe osmotic dehydration as a two-way transfer: water leaves while solute can enter. Concentration, temperature, immersion time, solution-to-product ratio, agitation and agent all matter. Shorter hot-air exposure may be offset by solids uptake, texture change or a product specification that the buyer didn’t request.
What Are the Steps in a Fruit and Vegetable Dehydration Process?
Plant processing commonly moves through receiving and sorting, washing, peeling or cutting where required, a crop-specific pretreatment, surface draining, controlled feeding, staged drying, cooling, representative sampling, conditioning when the product requires it, and moisture-barrier packaging. The sequence changes with the product. Fragile leafy material, dense root pieces and high-sugar fruit don’t need identical preparation or proof.
- Lock the sample identity: crop, variety, maturity, cut dimensions and pretreatment lot.
- Measure the incoming state: mass, relevant moisture basis, surface carryover and product temperature.
- Run a defined air program: record inlet and exhaust conditions, loading and time by zone.
- Test the product response: profile, texture, color, rehydration or another buyer-defined attribute.
- Set a release boundary: the plant’s validated quality and hazard controls remain outside a generic recipe.
Limited upstream examples can be seen on Shengtu root-vegetable washing and peeling line as well as Shengtu fresh-cut washing and leafy fresh-cut preparation line. Those linkages refer to different contexts, so don’t serve as evidence of a unified dryer program.
Why Temperature Alone Cannot Control Hot-Air Drying
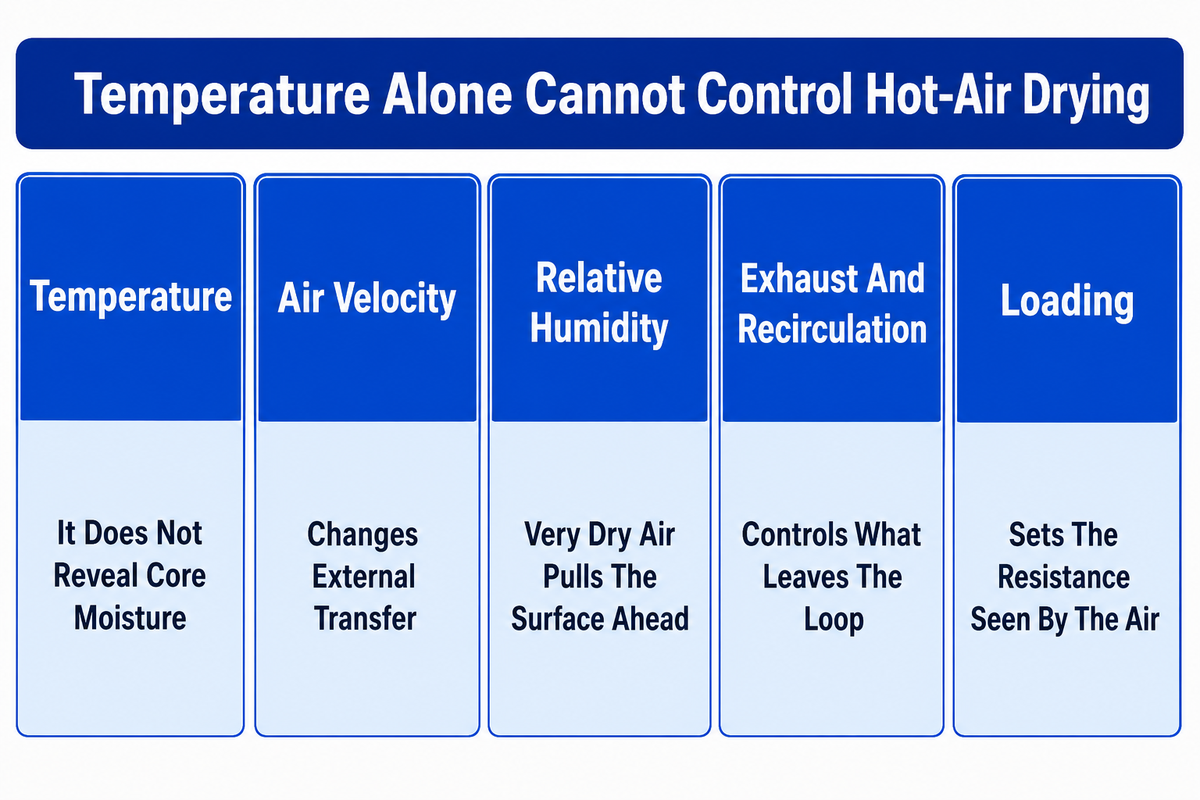
Hot-air drying operates by a complex balance between temperature, air velocity, relative humidity, exhaust, recirculation and product loading. Temperature provides the thermal driving force, but moisture only escapes when internal transport reaches the surface and the stream of air removes vapor without forming a harmful surface gradient.
Temperature
Changes vapor pressure, product temperature and quality-reaction rate. It does not reveal core moisture.
Air velocity
Changes external transfer and pressure distribution. More velocity can have a different result after internal resistance dominates.
Relative humidity
Changes the vapor-pressure driving force. Very dry air can pull the surface ahead of the core.
Exhaust and recirculation
Control how much absorbed moisture leaves the loop and how much sensible heat returns.
Loading
Sets the resistance seen by the air and the distance between a surface reading and the deepest product zone.
A published abstract from a mechanistic case-hardening paper reports that high drying rates can dry the surface ahead of the core and form a case-hardened layer. Full publisher text wasn’t accessible in this research run, so the article doesn’t attach a universal temperature, velocity or humidity threshold to that mechanism.
An infrared apple study offers a useful counterexample. Its tested airflow was 0.5–1.5 m/s, slice thickness was 2–6 mm and infrared intensity was 0.130–0.341 W/cm². Higher airflow prolonged drying in that apparatus while higher infrared intensity shortened it. The result can’t be transferred to a belt dryer, but it proves that “more airflow is faster” isn’t a universal rule.
Do: compare air-side conditions with a product response from the same time or lot.
Don’t: change temperature first for every wet pocket, dark edge or slow curve.
Temperature and airflow should be read with ambient air, exhaust and drying-chamber measurements. Controlled heat and airflow can support even drying only when the product bed and air path are measured. Claims such as uniform drying, consistent drying or consistent results need a position sample; they aren’t proved by the control-screen value.
Shengtu’s mesh-belt hot-air dryer page provides machine-level context. Product validation still needs the actual crop, bed, air circuit, residence profile and release requirement.
The 4-Layer Drying Evidence Window
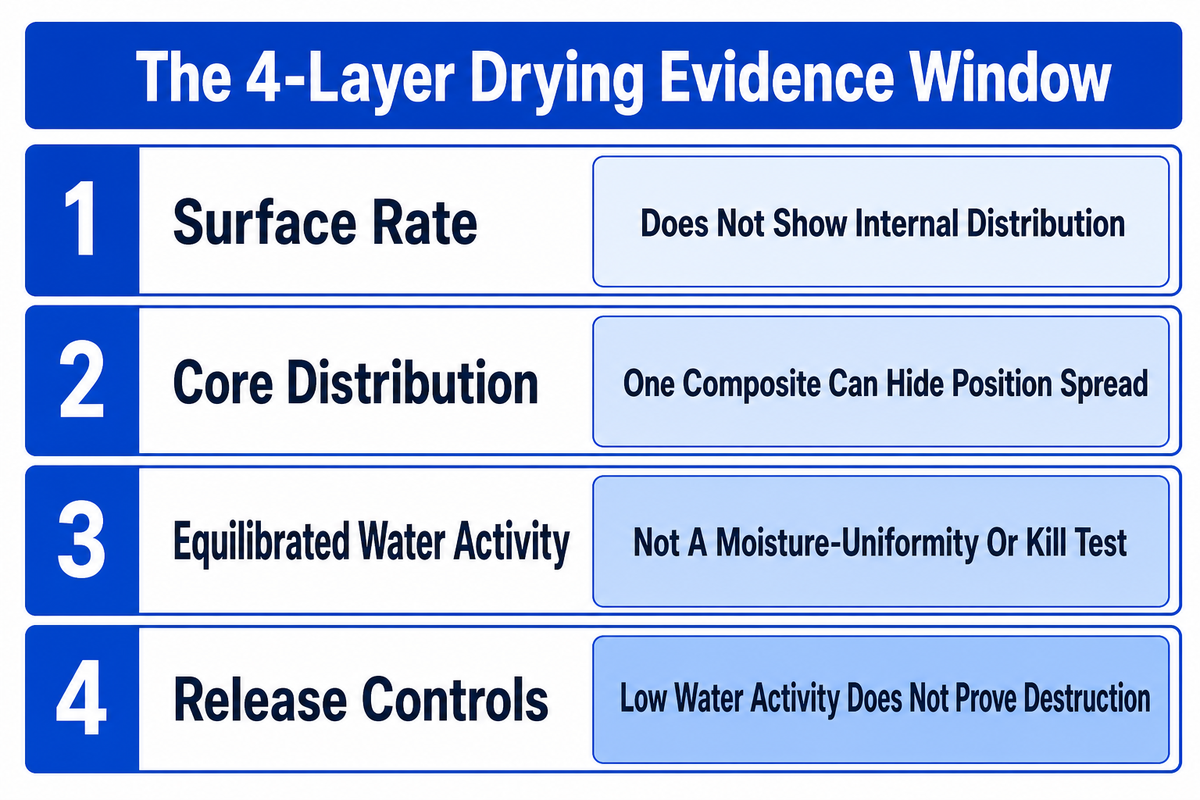
The 4-Layer Drying Evidence Window links surface removal rate, core moisture distribution, equilibrated water activity and release controls beyond moisture. The layers aren’t four interchangeable sensors. They’re four evidence questions that prevent a dry surface, one average or one water-activity reading from claiming more than it proves.
| Layer | Signal | What it can show | Confirming check | Limit and owner |
|---|---|---|---|---|
| 1 · Surface rate | Mass change over a defined interval | Whether the curve is still moving | Matched product mass and time | Does not show internal distribution · process |
| 1 · Surface rate | Inlet/exhaust temperature and humidity | Air-side pickup and available driving force | Calibrated sensors at defined locations | Air data are not product release data · process/maintenance |
| 1 · Surface rate | Surface temperature or image | Position pattern and possible overheating | Cross-section or internal sample | A surface image cannot prove core moisture · process/quality |
| 2 · Core distribution | Cross-section or center/edge sample | Dry shell, wet core or geometry effect | Replicate samples by piece class | Destructive sample may miss rare pockets · quality |
| 2 · Core distribution | Across-width and across-depth map | Air or loading imbalance | Fixed sampling coordinates | One composite can hide position spread · plant/quality |
| 2 · Core distribution | Piece-size distribution | Whether the sample covers the slowest geometry | Measured thickness bins in mm | A mean size conceals the tail · process/procurement |
| 3 · Equilibrated aw | Water activity after equilibration | Water availability at the test condition | Temperature-controlled duplicate reading | Not a moisture-uniformity or kill test · quality |
| 3 · Equilibrated aw | Sample/headspace temperature difference | Risk of measurement bias | Stable chamber and recorded °C | FDA cites about 0.005 aw shift per 0.1 °C at 25 °C in the referenced method · quality |
| 3 · Equilibrated aw | Moisture content beside aw | Quantity of water versus availability | Product-specific sorption relationship | Equal moisture can yield different aw · quality/R&D |
| 4 · Release controls | Validated microbial-control evidence | Whether a claimed control actually reduces the named hazard | Product/process validation | Low aw inhibits growth; it does not prove destruction · food-safety owner |
| 4 · Release controls | Cooling, exposure and packaging record | Risk of sweating, reabsorption or post-process exposure | Defined hold time and barrier check | Release remains product/facility specific · quality/operations |
| 4 · Release controls | Texture, stickiness, color or rehydration result | Buyer-use and physical-stability fit | Approved product specification | A safe product can still fail its use case · quality/procurement |
The FDA water-activity guide reports that, at 25 °C, a 0.1 °C difference between a sample and its headspace can produce about a 0.005 difference in the reading; a 1 °C difference can shift it by about 0.05. Those figures belong to the cited measurement discussion. Their practical message is simple: record equilibration and temperature before comparing lots.
The full-load litchi study shows why the second layer matters. Its 144.5 kg load on 17 trays finished with 38% moisture at the top tray and 12% at the bottom in the original cabinet. An inlet modification narrowed the split to 25%/21%. One average would have concealed the original gradient.
Water-activity evidence can’t claim microbial lethality on its own. In a peer-reviewed study of carrot, corn, onion, bell pepper and potato, Listeria monocytogenes and Salmonella enterica survived all tested conditions. Researchers inoculated samples at 4 log CFU/g, rehydrated them at 5 °C or 25 °C for 24 h, then stored them at 5 °C, 10 °C or 25 °C for 7 d. Their growth changed with product matrix and temperature. The fourth layer makes that boundary visible.
How Product Structure Changes the Drying Curve
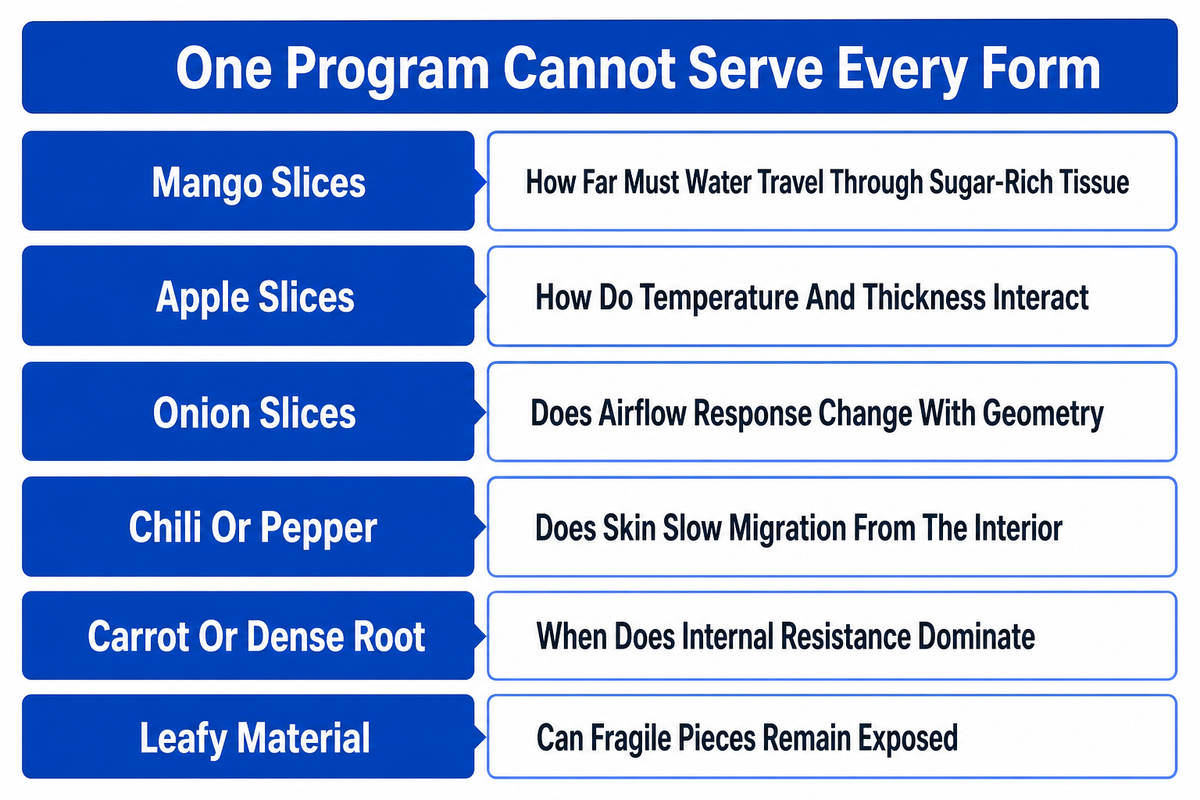
One dryer program can’t serve every fruit and vegetable form because the product sets the internal path. Tissue porosity, soluble solids, skin, cut geometry, maturity and pretreatment change diffusion, shrinkage, stickiness, color response and the evidence needed to call the lot finished.
The table below is a trial-design tool, not a recipe table. Three rows use direct crop studies; the other rows state questions that a plant should resolve with its own samples. No unsourced temperature window is supplied.
| Product type / form | Transport question | Trial variable | Risk to inspect | Proof required |
|---|---|---|---|---|
| Mango slices | How far must water travel through sugar-rich tissue? | 3, 6 and 9 mm bins in the cited study | Surface/core difference and quality loss | Curve plus profile and buyer texture |
| Apple slices | How do temperature and thickness interact? | 2, 4 and 6 mm at 50, 60 and 70 °C in the cited study | Shrinkage and uneven endpoint | Time, mass, dimensions and final profile |
| Onion slices | Does airflow response change with geometry and heat mode? | Airflow, thickness and infrared intensity in the cited apparatus | Browning, shrinkage and rehydration loss | Method-bound kinetics and quality tests |
| Garlic pieces | Are size and pretreatment consistent across the lot? | Measured size classes and pretreatment state | Dark edges and retained wet centers | Position samples and sensory specification |
| Chili or pepper | Does skin slow migration from the interior? | Whole, split and cut forms | Wrinkling with retained internal moisture | Cross-section and equilibrated aw |
| Carrot or dense root | When does internal resistance dominate? | Cube, strip and slice geometry | Slow core removal and texture hardening | Falling-rate curve and center sample |
| Leafy material | Can fragile pieces remain exposed without being blown or folded? | Feed density, air distribution and leaf size | Local overdrying and trapped layers | Across-width sample and breakage count |
| High-sugar fruit | Will the surface become sticky or collapse near the target state? | Maturity, soluble-solids class and final use | Sticking, caking and texture drift | Physical-stability and packaging test |
| Mixed product family | Which member defines the slowest valid endpoint? | Separate trial families, not one averaged program | A fast product masks a slow product | Worst-case product evidence and change control |
What Products Can a Dehydration Line Process?
Configured lines may process sliced fruit, root vegetables, onion, garlic, peppers, herbs or leafy products, but “can process” isn’t the same as “shares one program.” The supplier must show that feeding, air distribution, residence range and cleanability fit the intended form. The plant must then validate the product’s own quality and release evidence.
Can Drying Parameters Be Adjusted for Different Products?
Yes. Temperature, air velocity, humidity management, exhaust, recirculation and residence can be adjusted when the equipment provides those controls. Adjustment should follow a defined sample trial. Record the incoming product, geometry and load; change one planned factor or a governed group; then compare the complete curve, position samples and buyer-defined quality. Each saved program is evidence only for the conditions under which it was validated.
How to Read Case Hardening, Shrinkage, Darkening and Wet Pockets
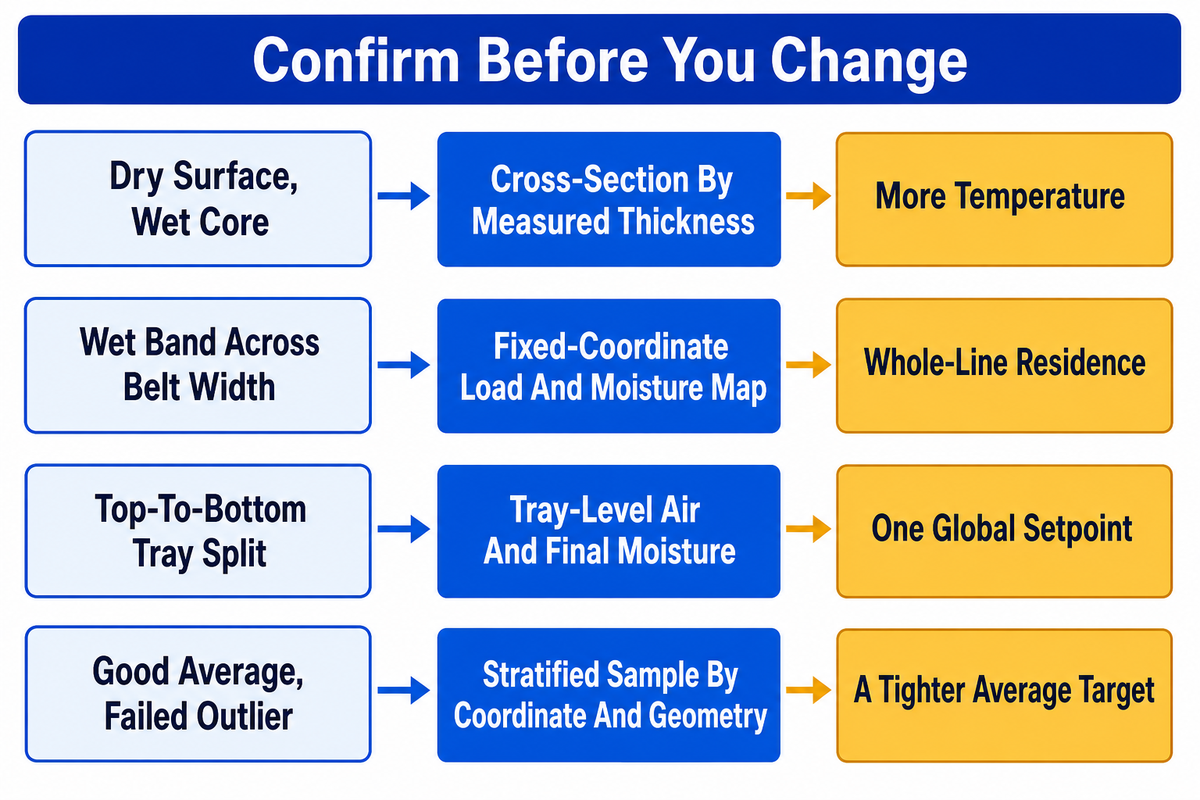
Visible defects are starting observations, not root causes. Case hardening, shrinkage, darkening and wet pockets can arise from product geometry, pretreatment, loading, air distribution, time or endpoint handling. The first useful move is to record where the defect occurs and obtain one corroborating signal.
| Observed symptom | Competing causes | Confirm first | Do not change first |
|---|---|---|---|
| Dry surface, wet core | High surface rate; thick cut; resistant skin; short residence | Cross-section by measured thickness | More temperature |
| Wet band across belt width | Air-distribution or feed-depth difference | Fixed-coordinate load and moisture map | Whole-line residence |
| Top-to-bottom tray split | Vertical air gradient; inlet geometry; unequal load | Tray-level air and final moisture | One global setpoint |
| Dark edges | Local heat exposure; thin tail; pretreatment drift | Edge thickness and position temperature | More airflow everywhere |
| Excess shrinkage | Tissue collapse; high rate; long exposure; crop state | Dimension and mass history | A texture additive |
| Sticky discharge | High sugar; warm product; incomplete conditioning; moisture pickup | Product temperature, aw and pack-room humidity | A lower endpoint without physical-stability evidence |
| Uneven color by zone | Temperature history; oxygen exposure; pretreatment or maturity | Zone log and incoming color class | Residence alone |
| Moisture rebound after cooling | Internal equalization; humid exposure; warm packing | Time-linked cooled samples and packaging barrier | Final-zone heat |
| Good average, failed outlier | Sampling plan misses position or size tail | Stratified sample by coordinate and geometry | A tighter average target |
In the litchi cabinet trial, the air-inlet change improved the top/bottom moisture split without extending the reported drying time. That doesn’t mean every uneven line needs an inlet modification. It shows the diagnostic value of a position map: the plant can test an air-distribution hypothesis against product evidence.
Is Dehydrating Fruits and Vegetables Healthy?
Dehydration can preserve food and concentrate solids by removing water, but nutrient and sensory retention depend on the crop, pretreatment, oxygen exposure, temperature and time history. Heat-sensitive compounds can decline, while some processing can protect color or improve a later use. No drying method makes a universal health claim. Evaluate the named product, nutrient or quality attribute with an appropriate method.
What Proves the Endpoint, and What Must Happen Before Release
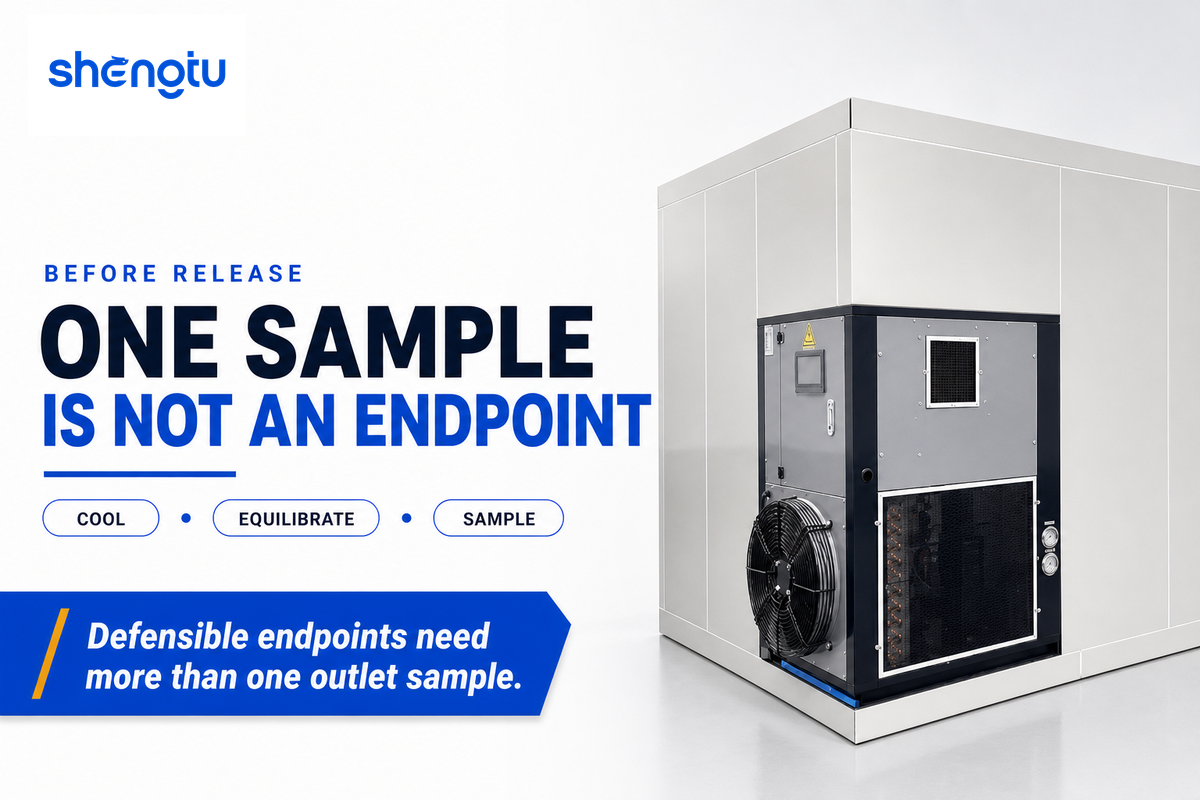
Defensible endpoints need more than one outlet sample. The plant should define the sampled population, position and geometry, cool or equilibrate the product as the method requires, measure the relevant moisture and water-activity fields, and then apply its separate quality and hazard-release controls.
“accurate and precise and adequately maintained”
Paragraph 117.40(f) applies all that language to instruments and controls used for conditions that control or prevent growth of undesirable microorganisms. It is not a general requirement of accuracy for all dryer sensors. The plant must determine whether a given measurement is used for such a control, and which requirements then apply in its own market and process.
Current 21 CFR 117.130 requires hazard analysis to consider biological, chemical and physical hazards, environmental exposure, formulation, equipment, processing, packaging, storage and intended use. The 4-Layer Drying Evidence Window therefore stops short of declaring food ready. Its fourth layer points to the plant’s validated controls.
- Freeze the sample plan: locations, piece-size classes, number of increments and lot identity.
- Cool under a defined condition because warm product can sweat or change a reading before packaging.
- Allow the method to equilibrate, then record sample and instrument temperature for water activity.
- Compare distribution with the mean; inspect outliers and position spread.
- Apply separate release controls for product specification, hazard plan, packaging and intended use.
University home-preservation sources explain the principle of conditioning as moisture equalization after cooling. Their 7-10 day jar procedure is not an industrial instruction. An industrial plant needs a product-specific hold, sampling and packaging method that matches its own volume, environment and release plan.
Residence Time, Bed Depth and Stage Handoffs
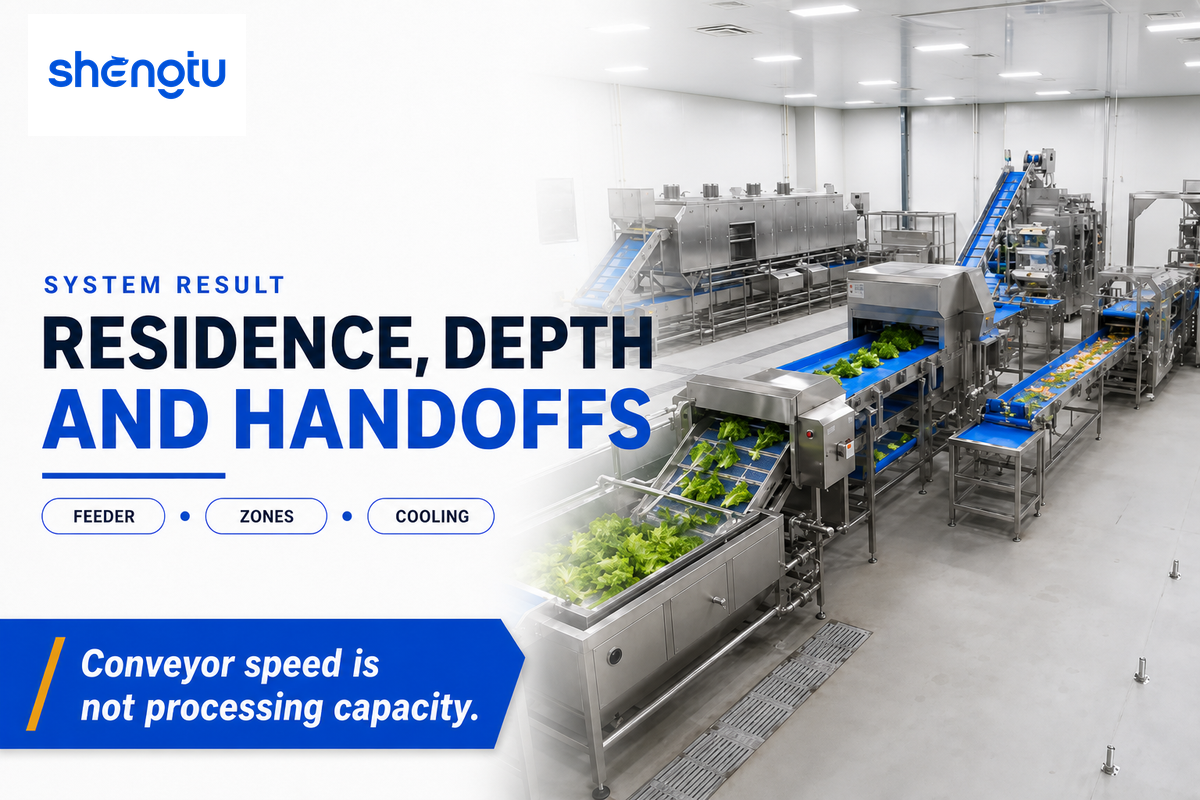
Usable line output is a system result. The endpoint and release method established above set the evidence target for this system result. Residence-time distribution, product depth, across-width feeding, air delivery and upstream or downstream timing can change final uniformity even when the dryer nameplate rate is unchanged. Evidence should therefore follow the material through each zone and handoff.
The 17-tray litchi study offers product evidence. Its 144.5 kg load moved from about 87% to 23% wet-basis moisture in roughly 15.5 h. After the inlet change, air mass flow fell from 0.3 kg/s to 0.1 kg/s while reported energy efficiency rose from 33% to 42%. Those results belong to one cabinet and crop.
Another 2025 study of a 32-tray cabinet used computational fluid dynamics and regression to test fan positions under one fixed geometry. The model fixed a 78.80 mm supply gap, 45° baffle angle, 2.74 m/s inlet velocity and 315 mm fan diameter; it reported R² 0.9247 and a best airflow-uniformity index of 76.5%. These values are not design targets for another dryer, but they show why geometry and air delivery must be validated together.
| Boundary | Record | Failure exposed | Owner |
|---|---|---|---|
| Cutting → pretreatment | Size distribution and lot time | Geometry drift blamed on dryer | Process |
| Pretreatment → draining | Treatment state and surface carryover | Added water changes early curve | Process/quality |
| Feeder → first zone | Mass flow and across-width depth map | Uneven load creates uneven air path | Plant |
| Zone → zone | Time key, inlet/exhaust state and sample | The curve changes but program does not | Process |
| Air loop → product bed | Pressure, air location and product coordinate | Average air value hides local path | Maintenance/process |
| Final zone → cooling | Product temperature and exposure time | Warm packing and sweating | Operations/quality |
| Cooling → sampling | Coordinates, geometry class and test time | Sample does not represent slow tail | Quality |
| Sampling → packaging | Release status and barrier identity | Approved lot reabsorbs moisture | Quality/procurement |
| Program → change control | Product, cut, load, software and hardware revision | Old validation is applied to a new condition | Owner/quality |
In continuous flow, conveyor speed and the loading profile on a conveyor belt help define residence, but neither one equals processing capacity. Production lines can lose usable output at a feeder, dryer, cooler or packer. Processing plants and processing facilities therefore need a shared lot key, operator training and a change record before a nameplate figure is treated as whole-line output.
This evidence map deliberately does not choose batch or continuous equipment, calculate capacity or set bed depth. Those are commercial and project decisions. The map tells a buyer which records should exist before a nameplate figure is treated as usable whole-line output.
What Is Changing: Pretreatment, Heat Recovery and Sensor-Driven Endpoints
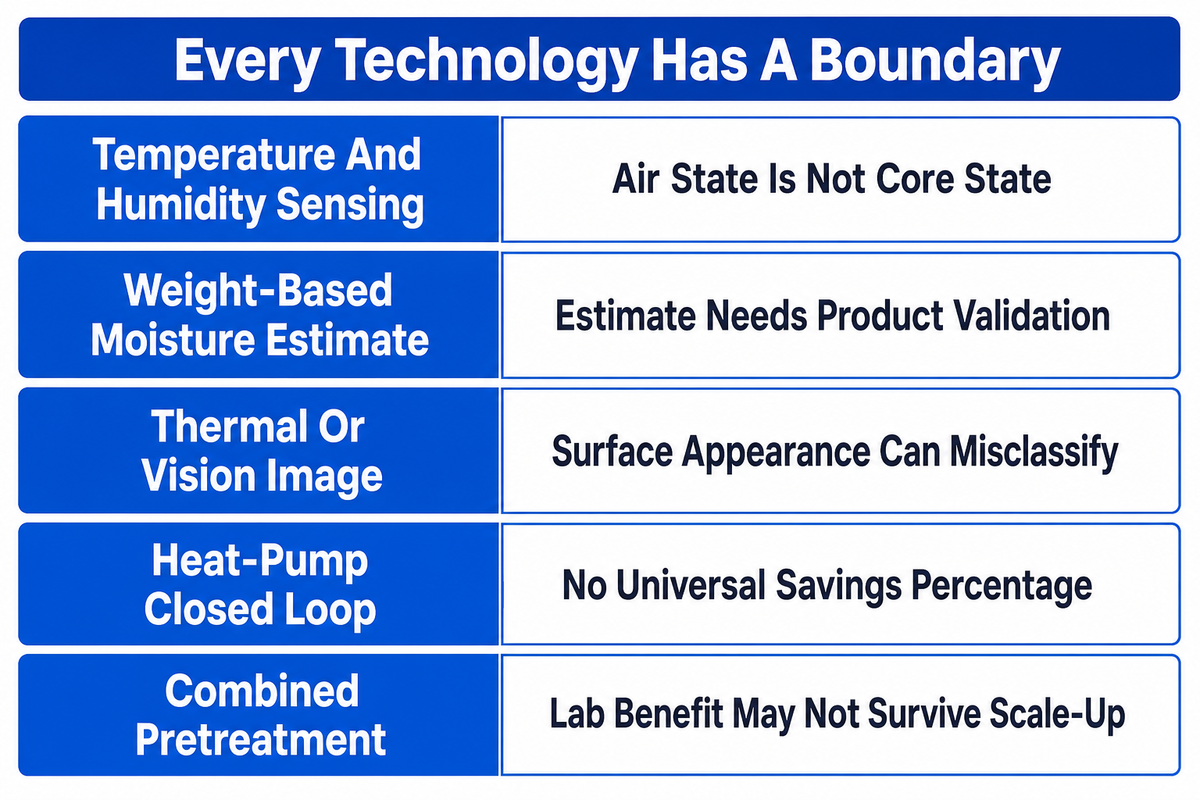
The useful trend is a change in what plants measure and validate. Heat-pump air loops, combined pretreatments, weighing, humidity sensing and imaging can add evidence, yet each technology has a product, calibration and scale boundary. “Smart” isn’t a result unless the signal changes a controlled decision.
The 2025 review describes heat-pump drying as a closed loop in which humid air is cooled to condense water and then reheated. It also calls for further work on core components, technology combinations and product-specific quality mechanisms. The review supports a readiness discussion, not a Shengtu energy-savings claim.
| Technology | Evidence available | Buyer question | Boundary |
|---|---|---|---|
| Temperature/humidity sensing | Mature measurement components | Where are sensors placed and calibrated? | Air state is not core state |
| Weight-based moisture estimate | Patent and equipment concepts | How is tare, load spread and recipe change handled? | Estimate needs product validation |
| Thermal or vision image | Research and patent demonstrations | Which core or quality result was it calibrated against? | Surface appearance can misclassify |
| Heat-pump closed loop | Commercial use plus active research | What product, ambient condition and load support the energy case? | No universal savings percentage |
| Combined pretreatment | Many crop-specific studies | What solute uptake, texture or cleanup tradeoff appears? | Lab benefit may not survive scale-up |
Drying systems may be offered as cabinet dryers, tunnel dryers, belt equipment or combined drying solutions. Buyers should ask which line applications and processing needs were tested, how energy efficiency was measured and which product state controlled the endpoint. A turnkey label doesn’t answer those questions.
Material claims need the same discipline. If a proposal names 304 stainless steel or food-grade stainless steel, verify the exact food-contact scope, finish, cleaning method and applicable requirement. The phrase food-grade alone doesn’t prove the sanitary design of dehydration equipment or an entire processing line.
FDA’s computerized-systems inspection guide gives a useful proof standard for critical food-process controls: test the configured system under actual and worst-case conditions, record observed values, test duration and range, and do not treat vendor qualification as the complete validation. The guide says at least three consecutive successful test runs are generally expected across different operating conditions.
Shengtu’s company-level capabilities include its STUnit platform, low-code control boxes, multi-protocol gateways, vision methods and edge algorithms. Those organization-level capabilities don’t prove that this specific line includes any feature or achieves an outcome. Each project discussion must bind proposed signals to hardware, software, product evidence and an acceptance method.
When Process Evidence Must Become Project Scope
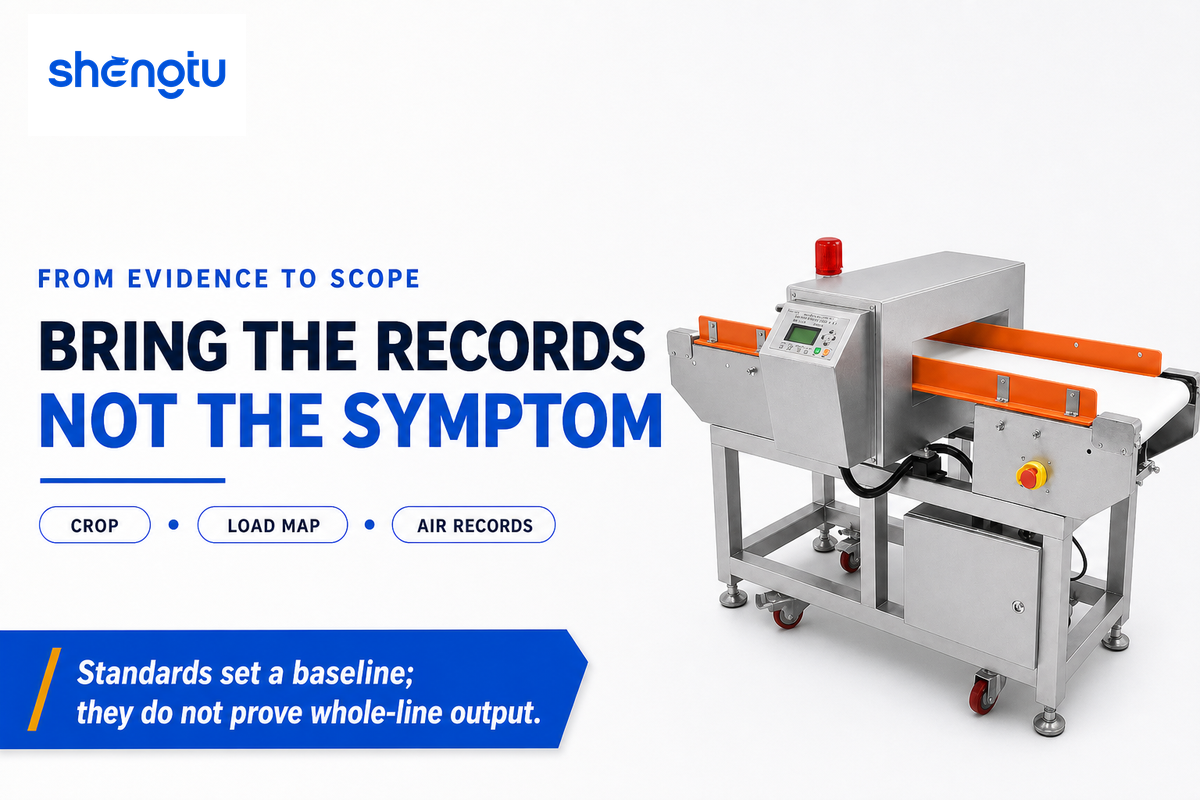
Educational diagnosis ends when a decision requires a configured line. Capacity, layout, utilities, interfaces, controls, sanitation scope, destination-market requirements and acceptance evidence depend on the actual product family and plant. Recognized standards may establish baseline attributes, but they don’t prove whole-line output or crop results. FDA’s HACCP principles and application guidelines make the same point from the plan side: a hazard plan and its validation have to reflect each product, process, distribution condition, facility layout and equipment context.
Shandong Shengtu Bufan Intelligent Technology Co., Ltd. provides food-machinery research, manufacturing and whole-plant digital solutions. The organization reports 100+ research projects, 100+ software copyrights and 7 patents; its listed credentials remain company-level and aren’t presented as machine certification.
Use the configured F&V dehydration drying line Page when the discussion moves from process evidence to equipment and project scope.
Discuss a Configured F&V Dehydration Line
Frequently Asked Questions
What does F&V mean in a dehydration drying line?
F&V means fruit and vegetable. In an industrial context, an F&V Dehydration Drying Line can connect preparation, controlled feeding, staged drying, cooling and verification for produce. The abbreviation describes the product family, not one machine arrangement or one crop program. Equipment and evidence still change with geometry, pretreatment and intended dried product.
Is surface dewatering the same as product dehydration?
No. Surface dewatering removes free water left by washing and may prepare fresh-cut produce for packing, freezing or another step. Product dehydration removes water from inside tissue and needs a drying curve, internal-distribution evidence and a product-specific release plan. The two operations can sit on one processing line, yet their sampling and release criteria remain separate. Surface appearance can’t prove a dry core.
What measurements define a finished dehydrated product?
No single measurement defines every product. Plants may need moisture content, position spread, equilibrated water activity, product temperature, texture, color, rehydration or another buyer specification. Separate hazard and environmental controls still apply. Four-layer evidence shows how those fields relate without inventing a universal limit. Sampling coordinates and cut-size classes should travel with the result, while cooling time, package barrier and intended use remain part of release. Accepted fields and limits must come from the product’s validated plan, not this guide.
Does a higher air temperature always shorten drying time?
No. Higher temperature can raise the driving force, yet internal transport may still limit removal. Surface drying can outrun the core, so inspect the product profile before adding heat.
Why can a product be dry outside and wet inside?
External removal can outpace internal moisture movement. Thick cuts, resistant skin, high surface drying rate or short residence may create a dry outer region above a wetter core. Check a cross-section and stratify samples by geometry and position. More heat can intensify the gradient instead of correcting it.
Can one drying curve work for onions, mangoes, apples and leafy vegetables?
No single curve should be promised without trials. Tissue, soluble solids, skin, cut geometry, pretreatment and target texture change the moisture path. Create separate trial families and record the incoming product state. Each saved program remains valid only inside its approved product and process change boundary.
Is dehydration a pathogen kill step?
Not automatically. Low water activity can prevent proliferation under defined conditions, yet pathogens may survive dehydration. Researchers testing five dehydrated vegetables found Listeria and Salmonella survival under all tested conditions and matrix- and temperature-dependent growth after rehydration. Any kill claim requires product- and process-specific validation under the applicable hazard plan.
When should a process problem be taken to a line supplier?
Move to a supplier discussion when the diagnosis depends on airflow geometry, residence range, feeding, utilities, controls, interfaces, sanitation design or equipment changes. Bring crop identity, cut distribution, pretreatment state, load map, air records and position samples. That evidence lets the supplier address a defined project condition instead of guessing from one symptom.
References & Sources
- eCFR, 21 CFR 117.40 Equipment and utensils
- eCFR, 21 CFR 117.130 Hazard analysis
- FDA, Water Activity in Foods
- FDA, 2026 Ready-to-Eat Fresh-Cut Produce Guidance
- FDA, Computerized Systems in the Food Processing Industry
- FDA, HACCP Principles and Application Guidelines
- Fay et al. — Pathogen survival and growth on dehydrated vegetables
- Carrot-cube convective drying heat and mass transfer study
- Pineapple diffusion, evaporation and shrinkage model
- Infrared apple dryer airflow and intensity study
- 32-tray cabinet-dryer airflow CFD study
- Gulati and Datta, Case-hardening mechanism
- Precoppe et al. — Litchi cabinet-dryer uniformity study
- Mango slice thickness and drying-method study
- Apple slice temperature, thickness and shrinkage study
- Onion airflow, thickness and infrared-convection study
- Fresh-cut fruit and vegetable pretreatment review
- Fruit and vegetable heat-pump drying review
- EHEDG, GFSI hygienic-design scope guidance
- NSF, Food Equipment Standards portfolio