
Get in touch with Shengtu Bufan Company

![Dry Kibble Extrusion Line: Process Control Guide [2026]](https://shengtumachinery.com/wp-content/uploads/2026/08/dry-kibble-extrusion-line-guide-featured.png)
A dry kibble extrusion line is a connected processing system that turns a prepared recipe into stable, coated pieces through dosing and grinding, mixing, preconditioning, extrusion cooking, cutting, drying, cooling, coating, and packaging. Control is effective when each stage delivers a measurable product state to the next, not when an operator holds every setpoint constant.
Start diagnosis with the visible symptom, then find a second signal from the same production interval. Check the nearest upstream material state before changing temperature, screw speed, water or airflow. Formula, particle size, moisture distribution, thermal input, mechanical energy, die condition, dryer loading and coating all interact. This is why a stable machine setting can produce a different kibble after a recipe or rate change.
This guide details the feed extrusion process and provides plant teams with two practical tools: a 12-symptom failure-mode register and a stage-linked measurement matrix. It doesn’t provide one-size-fits-all recipes, food-safety limits, machinery brands, or commercial line setups.
Pet Food Production: How Dry Kibble Moves Between Stages
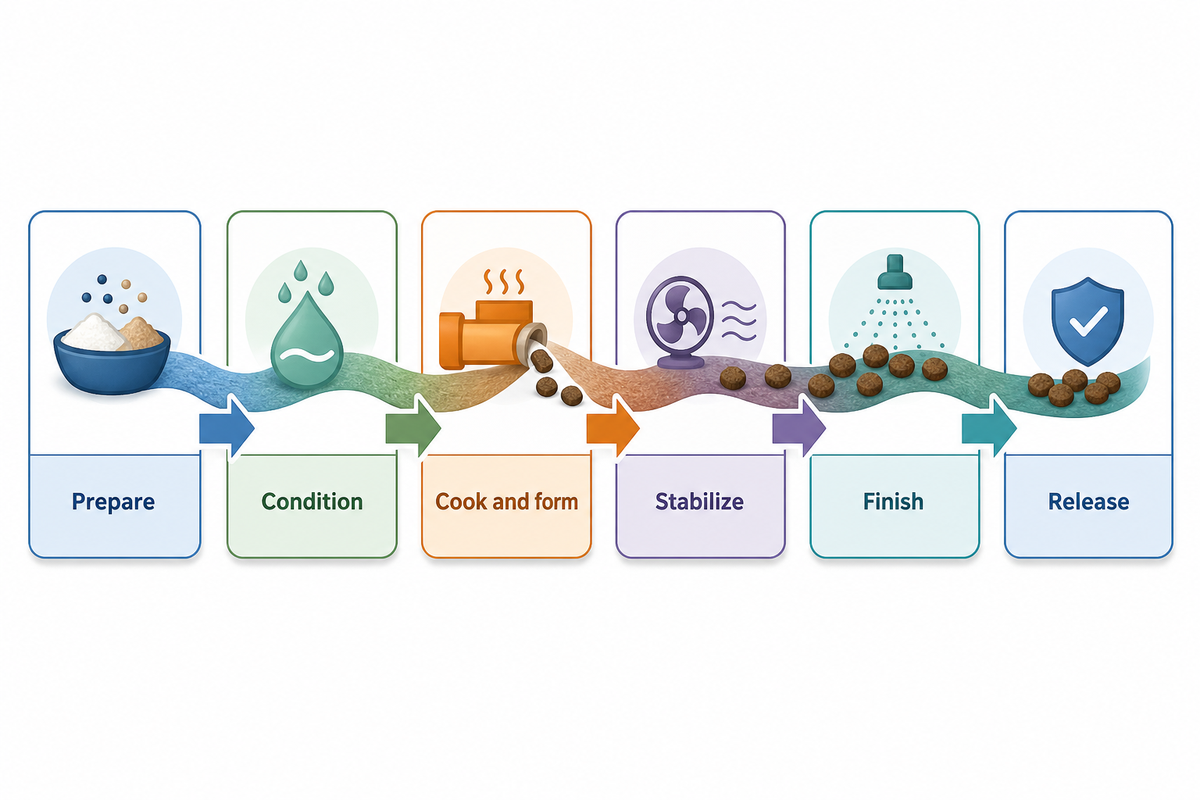
Pet food production is a chain of material-state changes. Raw ingredients are received, screened, ground, and dosed so the dry mix enters the line with a repeatable particle-size distribution and composition. Mixing distributes macro- and micro-ingredients. Preconditioning, sometimes written pre-conditioning, then adds water, steam, time, and agitation before the meal reaches the extruder barrel.
Inside a pet food extruder, rotating screws convey and mix the dough while thermal and mechanical energy change viscosity, starch state, protein structure, and flow. At the die, the pressure drop allows part of the water to flash to vapor. As the strand expands, a cutter sets its length, and the still-wet kibble passes to the dryer. Cooling prepares it for coating or packaging; liquid fat and palatant application can then modify surface properties and acceptance.
- Prepare: control ingredient identity, particle size, dosing, and mixing.
- Condition: distribute steam and water while the meal is agitated.
- Cook and form: combine heat, shear, pressure, and residence time in the barrel and die.
- Stabilize: remove and equalize moisture in the dryer, then lower product temperature.
- Finish: apply fat and palatants with a defined surface and product-temperature condition.
- Release: assess the finished lot against the plant’s validated quality and food-safety standards.
The handoff matters as much as the station. If a feeder pulses, the preconditioner receives a varying solids rate. If wet kibble reaches the dryer in a changing bed depth, one outlet average can hide a cross-bed variation. For traceability, a pet food production line needs a common time or lot key throughout the line. This stage-to-stage view helps the pet food industry and the wider food industry connect a defect with material evidence.
What Food Extrusion Changes Inside a Pet Food Extruder: Structure and Nutritional Quality
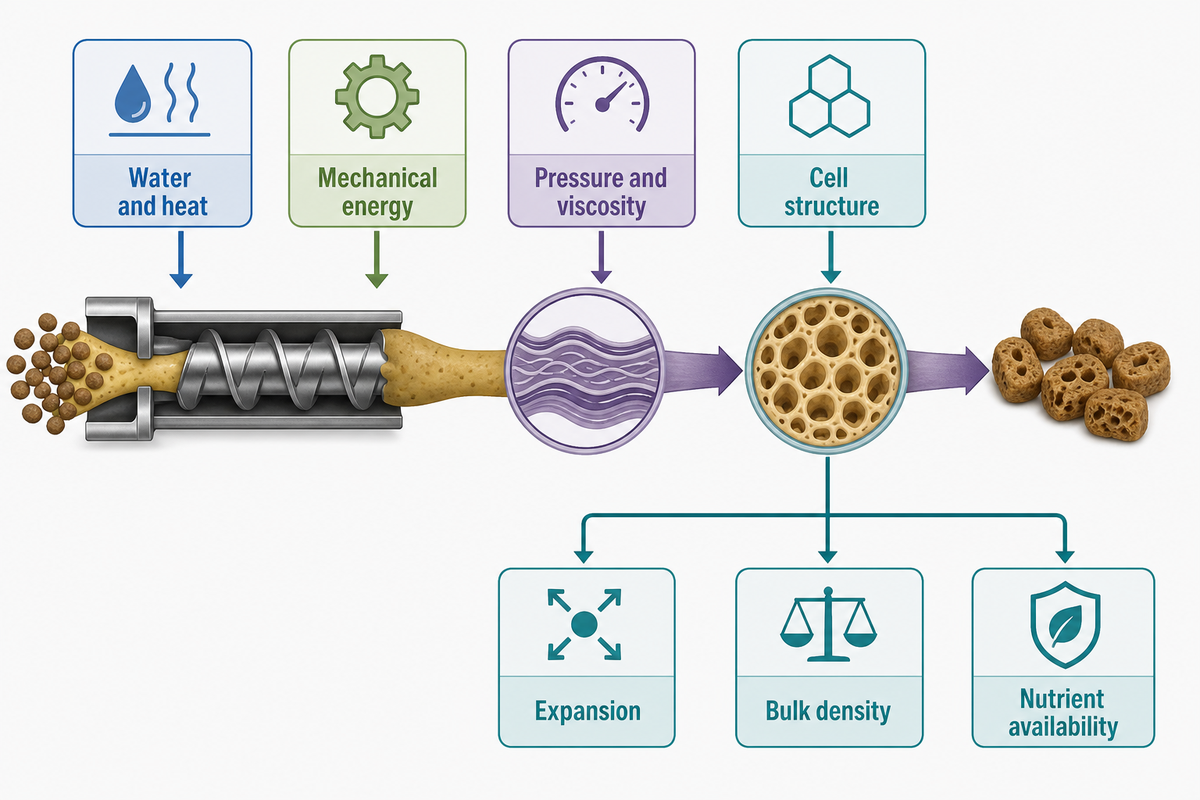
Food extrusion combines continuous mixing, cooking, and forming. Material entering the barrel is not merely pushed through a shaped opening. Water and heat soften the matrix, screw work adds mechanical energy, pressure and viscosity govern flow, and the die creates a rapid pressure change. Resulting cell structure influences expansion, bulk density, texture, breakage, and drying behavior.
One large-scale dog-food study shows why treatment values must stay attached to context. Its high-, medium-, and low-shear treatments used one recipe and one production system. Published measurements below allow comparison of the responses; they are not an operating range for another dog food extruder.
| Study measurement type | High-shear treatment | Medium-shear treatment | Low-shear treatment |
|---|---|---|---|
| Preconditioner load | 33.8% | 32.7% | 32.3% |
| Preconditioner moisture | 20.0% | 25.2% | 25.3% |
| Preconditioner temperature | 88.9°C | 88.0°C | 87.2°C |
| Mass flow rate | 1,184 kg/h | 1,266 kg/h | 1,308 kg/h |
| Motor load | 62.8% | 47.2% | 41.3% |
| Specific mechanical energy | 39.5 Wh/kg | 27.9 Wh/kg | 23.6 Wh/kg |
| Specific thermal energy | 32.8 Wh/kg | 33.5 Wh/kg | 32.7 Wh/kg |
| Total specific energy | 72.2 Wh/kg | 61.3 Wh/kg | 56.3 Wh/kg |
| In-barrel moisture | 25.8% | 31.2% | 31.3% |
| Wet bulk density | 386 g/L | 428 g/L | 435 g/L |
| Dry bulk density | 296 g/L | 324 g/L | 338 g/L |
| Moisture loss at dryer | 6.98% | 13.04% | 13.16% |
Practically, the lesson is directional: mechanical, thermal, and moisture inputs did not behave as one variable, while density, expansion, and starch transformation changed. Transfer the diagnostic relationship, not the treatment values.
Equipment context further limits transfer: that experiment reported a dry-mix bulk density of 668 g/L, initial moisture of 11.6%, a constant knife speed of 700 rpm, a 100 hp drive, an approximately 1.495 m barrel, an 11.41 cm screw diameter, and four 0.82 cm die holes. These details describe that trial; none is a target for another plant.
How Does the Extrusion Process Affect Nutritional Quality?
The cooking process can change starch gelatinization, protein structure, nutrient availability, vitamins and minerals, and other heat-sensitive compounds. High temperature and pressure still do not produce one predictable nutritional result. Response depends on formulation, moisture, energy distribution, time, and the nutrient being measured. Crude nutrient level or calculated nutritional value is not the same as bioavailability; reactive lysine, digestibility, and animal response need suitable methods of their own.
In another controlled dog-food study, one recipe was processed through six preconditioner-discharge temperatures from 45°C to 95°C. Higher thermal input reduced mechanical-energy demand and changed gelatinization and expansion, while apparent nutrient digestibility and palatability did not move in the same simple direction. These treatment temperatures show a coupled energy pathway; they do not define a universal cooking window. Because this six-temperature trial was built around one recipe and one production system, an honest reading preserves the trade-off: treating its response as industry truth risks an inconsistent conclusion for another line.
“The modifications in extrusion processing mechanical energy had an impact on kibble characteristics and starch transformation.”
I. Corsato Alvarenga et al., Kansas State University researchers
Define the product response before judging the process. Track structure, starch or another relevant transformation, and the validated nutrient measure separately. Results from one study cannot prove balanced nutrition, a “complete and balanced” claim, or suitability for the dietary need of every dog or cat. For pet owners, suitability for dogs and cats cannot be inferred from extrusion data; ration formulation and feeding evidence remain separate.
How Raw Material State and Preconditioning Set the Extrusion Process
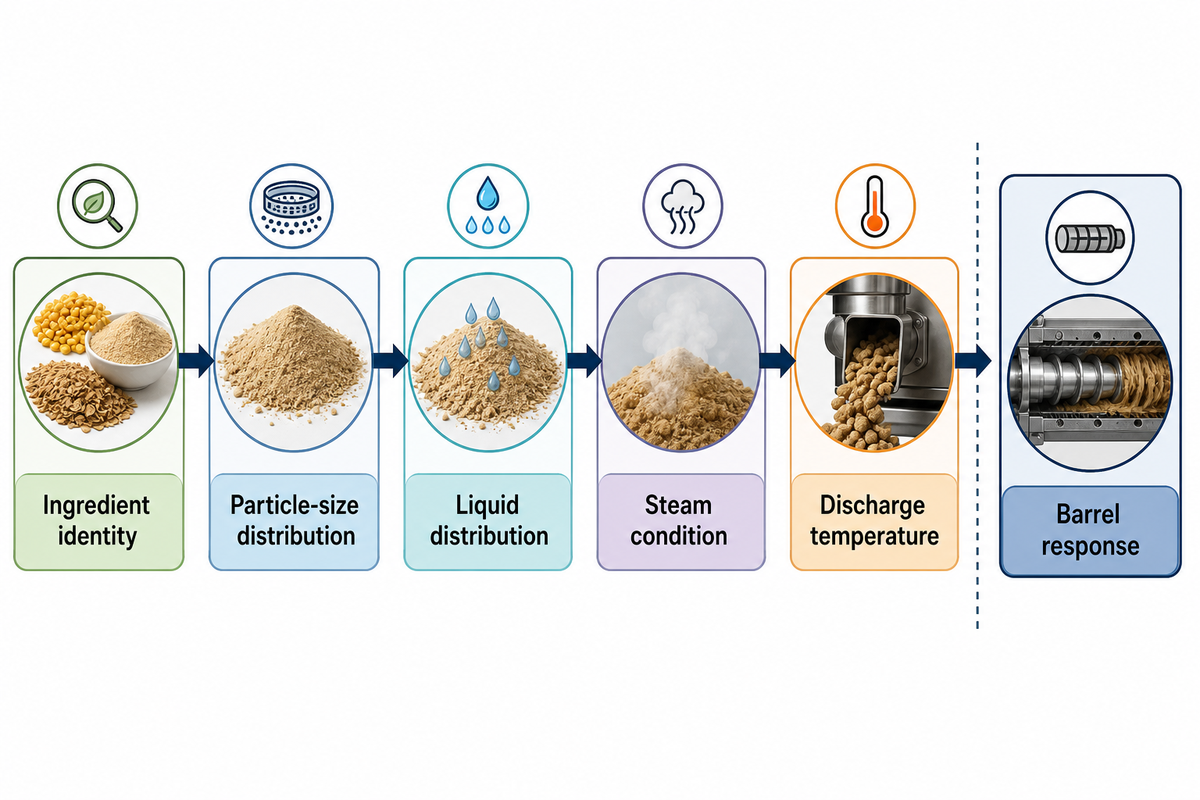
Barrel controls can’t fully correct an inconsistent feed stream. Ingredient identity, grind, dosing accuracy, mixing, liquid distribution, and storage condition affect how the meal absorbs water and transmits shear. A nonuniform meat slurry can show up first as surging, irregular shape, or bulk-density drift. Those symptoms may look like an extruder fault even when the disturbance began during batching or mixing.
Particle-size distribution affects hydration rate and packing. Large or resistant particles may remain less conditioned than the surrounding meal, while excessive fines can change flow and water demand. Fat added too early can coat particles and slow hydration. Fiber source and inclusion can alter water binding, viscosity, expansion, texture, and dryer response. The same mass of added water does not guarantee the same dough state when the formula changes.
NC State Extension describes preconditioning as the distribution of water and steam before extrusion, commonly with roughly 2–4 minutes of mixing in the equipment it discusses. It also gives a conditional process boundary: operation below about 18% process moisture may not need preconditioning, while operation above roughly 18–20% can benefit from added conditioning and reduced barrel shear demand. These figures explain a mechanism; they aren’t dry-kibble recipes.
This extension factsheet supplies established mechanism context, not a current equipment specification. Confirm residence time, moisture basis, steam quality, and safe operating limits against current machine documentation and the plant’s validated process.
If a dry-feed run becomes unstable, compare the scheduled formula with the material actually entering the line. Verify feeder rate, batch identity, grind distribution, liquid flow, steam condition, preconditioner fill, and discharge temperature. Align samples by time; a conditioner sample taken after the disturbance has passed can create a false comparison.
- Observe first: feeder-rate trace, liquid-flow trace, preconditioner discharge temperature, and sample appearance.
- Corroborate: compare the disturbance time with motor load, die pressure, bulk density, and shape.
- Avoid: raising barrel heat before checking whether incoming meal or water distribution changed.
How Pet Food Extrusion Links Temperature, Pressure, Shear, and Residence Time
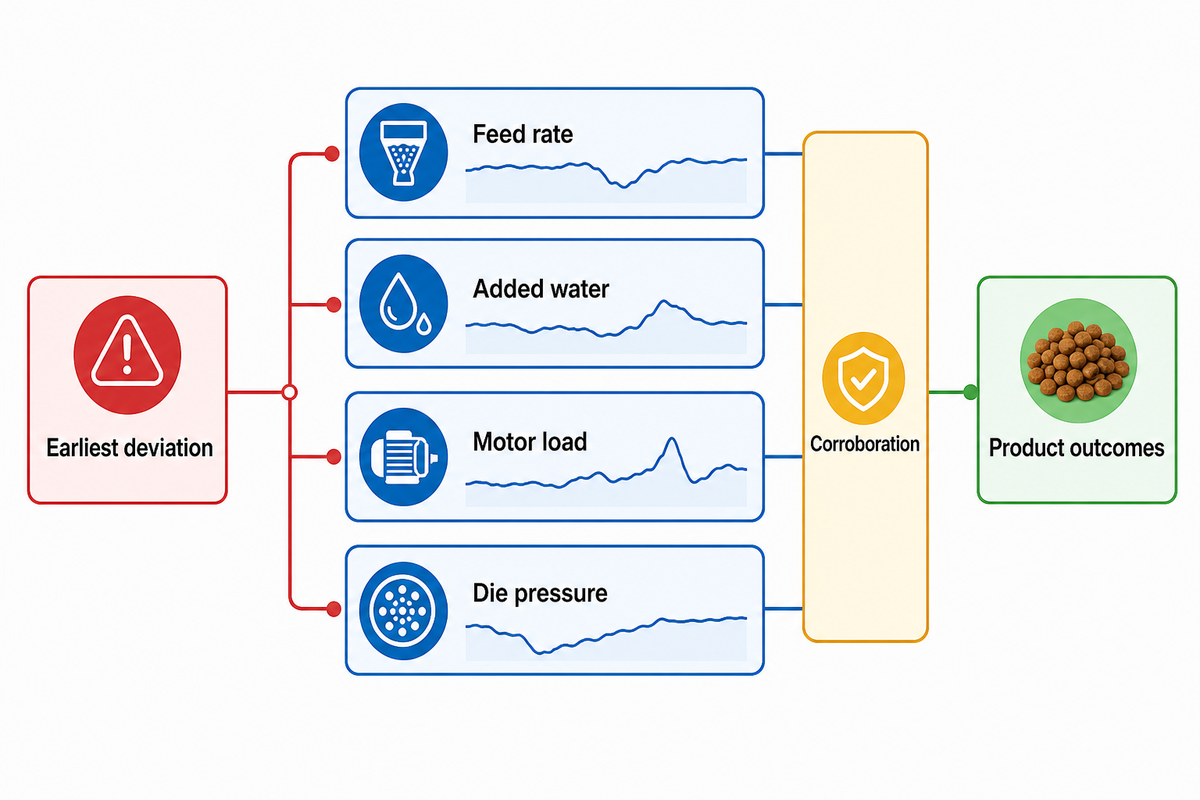
Temperature, pressure, shear, and residence time describe different parts of the extrusion system. They interact, but they aren’t interchangeable extrusion parameters. Steam and barrel heat add thermal energy. Screw rotation and material resistance add mechanical energy. Pressure reflects resistance to flow at a stated location, while residence time describes how long material experiences the changing environment. Dough viscosity connects the four.
Consider a rate increase. More mass can shorten residence time, change barrel fill, and raise or lower motor load depending on the screw configuration and material. Added water may reduce viscosity and load, yet it also changes die flash-off and dryer demand. Higher screw speed can increase shear rate and throughput, but specific mechanical energy (SME) still depends on torque and mass flow. Pressure may rise because viscosity, die restriction, or rate changed; the pressure reading alone can’t distinguish those paths.
Which Signal Should You Trust First?
Don’t accept a single signal as a diagnosis. Begin with the earliest timestamped deviation and seek corroboration before making a change. If motor load moves while feed rate, added water, and die pressure stay stable, inspect drive and screw-zone evidence. If motor load and die pressure move together after a feed or water change, inspect the material state. If shape changes while barrel signals remain stable but the cutter trace shifts, check cutting before altering cook.
The same barrel setpoints can produce a different kibble when fiber, fat, particle size, or water-binding capacity changes. Operator trends or models can narrow the search, but they must distinguish measured values from inferred ones. Extrusion-modeling research likewise treats final properties as responses mediated by melt temperature, viscosity, pressure, residence time, and energy input.
Useful control-system records separate manipulated inputs, intermediate process states, and product outcomes. This prevents a setpoint from being mistaken for proof of cook. It also shows coupled-energy behavior: more thermal input can alter the mechanical work needed to reach a material state, but the size and direction of that change depend on formulation and equipment. Judge extrusion technology by measurable responses, not by one number on a control screen.
Why Die Release Changes Kibble Expansion, Bulk Density, and Shape
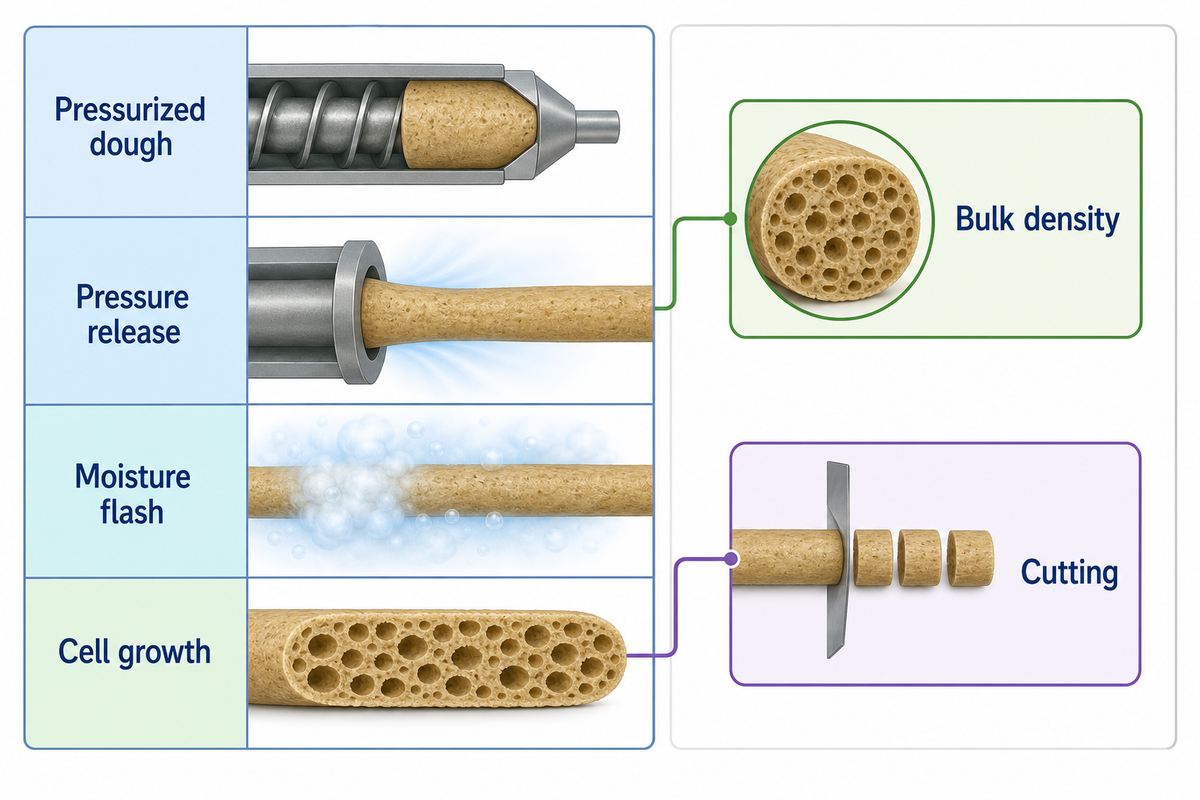
In turn, hot pressurized dough reaches the die and enters a lower-pressure environment. Part of its water can flash to vapor, bubbles grow, and the matrix stretches before cooling and moisture loss set the structure. Die geometry, die-plate open area, and land length influence flow resistance and strand shape. Cutting converts the strand into pieces, but it can’t repair a weak or uneven internal structure.
Expansion and bulk density often move in opposite directions: a more expanded cellular product commonly occupies more volume per unit mass. The relationship is not always linear. Cell-wall collapse, post-release shrinkage, uneven moisture, surface tearing, or formulation differences can break a simple one-to-one relationship. Reading both outcomes together is more useful than either value alone.
For diagnosis, measure piece dimensions, unit mass, bulk density, expansion, cut quality, and breakage on time-linked samples. Pair those outcomes with die pressure, product temperature, screw load, moisture addition, and cutter speed. Pressure changes without a matching density or shape response may reflect instrumentation, transient flow, or an operating shift absorbed by the product matrix. Density shifts with stable die pressure may start upstream or continue after the die through shrinkage and drying.
Visible defects often share potential causes. Ragged ends could result from cutter condition, strand temperature, die wear, or dough condition. Variable length could be cutting and/or surging. Surface blisters could come from flash-off, trapped vapor, or over-drying. Choose the closest and most discriminative signal for the first test, not the nearest setpoint.
How Drying, Cooling, and Coating Control Moisture and Palatability
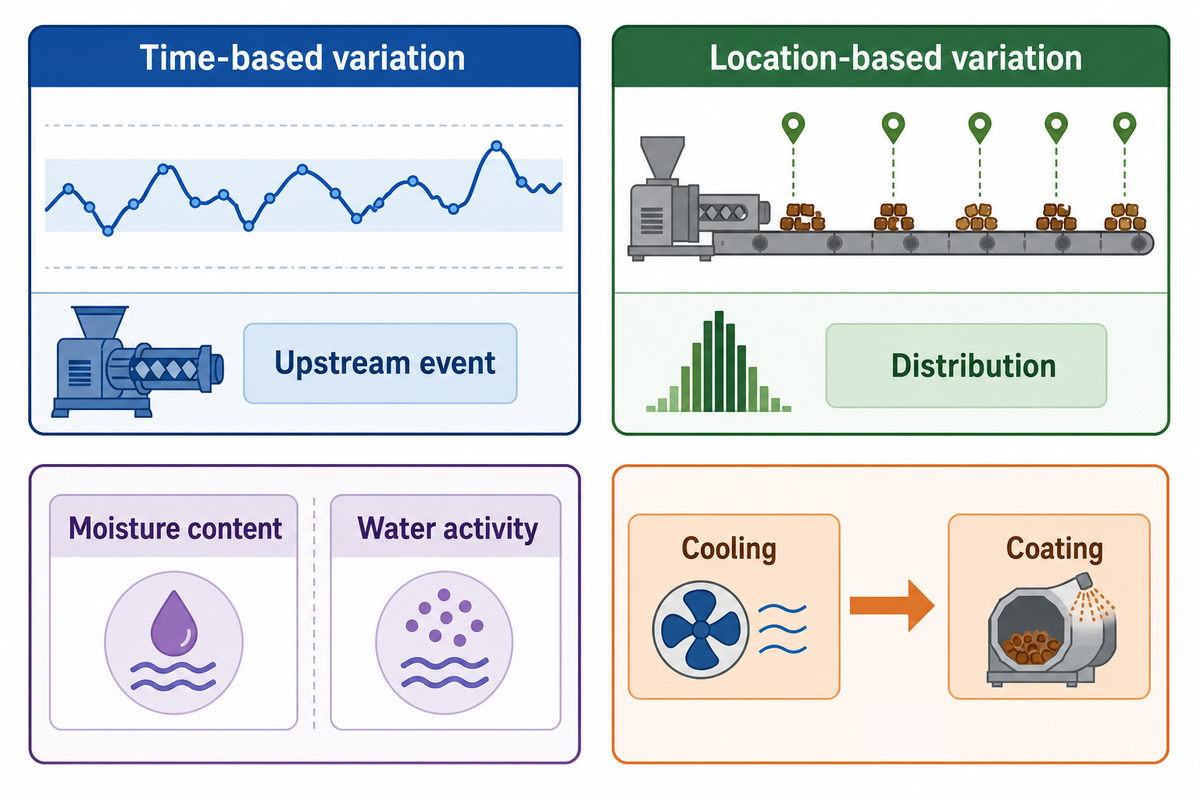
After die release, drying and cooling determine whether the kibble’s moisture and temperature are suitable for the next handoff. Dryer feed has a particular size, porosity, temperature, loading pattern, and incoming moisture. Air temperature matters, but so do humidity, velocity, distribution, bed depth, residence time, product agitation, and combustion performance.
A small discharge-moisture shift can come from airflow, residence time, bed loading, or combustion—not just temperature. One trade troubleshooting example used a 1.3% outlet-moisture change as the reason to inspect the whole drying system. Another described a dryer cross-section of nine samples within ±1 percentage point of moisture. Both are diagnostic examples from specific equipment discussions, not universal release limits.
Why Can Final Moisture Still Drift?
An outlet average may be unchanged while the bed forms a wet edge and dry center. It may also change because incoming piece geometry or porosity changed, even though the dryer setting remained static. Compare a cross-bed sample pattern, residence time, air condition, loading, and incoming product state.
If the variation is time-based, suspect the upstream event and control response. If it is location-based, suspect distribution.
Moisture content is not water activity. Moisture content measures the quantity of water present; water activity describes how available that water is at thermodynamic equilibrium in the product matrix. Ingredients bind water differently, so two formulations can have the same moisture content but different water activity. Measurement temperature and equilibration also matter.
The FDA notes a measurement-principle example: at 25°C, a 0.1°C difference between sample and headspace can change a water-activity reading by about 0.005. That is not a pet-food release threshold. Each facility must use validated sampling, equipment, limits, and corrective actions within its food-safety system.
This cited FDA technical guide supports the physical measurement caution; it is not an operating manual for a particular meter. Follow the current instrument method, calibration procedure, sample-equilibration requirements, and applicable food-safety plan.
Cooling should prevent condensation and create a consistent surface condition for coating or packaging. Coating behavior depends on kibble surface, porosity, temperature, liquid properties, application, and mixing. Palatability and food acceptance aren’t always improved by changing one coating time or dose. Published review evidence on dry pet-food palatability emphasizes interactions among formulation, processing, fat, palatants, and animal response.
Moisture control must be evaluated with drying temperature, airflow, load, uniformity, and release evidence. Energy efficiency and reducing energy consumption are separate objectives; neither justifies moving a food-safety or product limit without validation.
12-Symptom Kibble Failure-Mode Register

Use the 12-Symptom Kibble Failure-Mode Register as a triage tool, not a sequence or recipe. Select the visible symptom, find the corroborating signal in the same time window, and perform the first upstream check. Its final column names a tempting change to postpone until evidence distinguishes the competing cause.
| Observed symptom | Corroborating signal | First upstream check | Competing cause | Change to avoid first |
|---|---|---|---|---|
| Extruder surging | Feeder, liquid-flow, motor-load, and die-pressure traces oscillate together | Confirm solids feed, slurry uniformity, and preconditioner discharge continuity | Restriction or worn conveying elements | Do not raise screw speed before locating the oscillation source |
| Bulk density rises | Expansion falls on the same timed sample | Compare incoming moisture, thermal input, specific mechanical energy, and formula lot | Post-die shrinkage or dryer effect | Do not treat die pressure as the sole cause |
| Bulk density falls | Pieces expand more but walls appear weak | Check formula, water addition, energy response, and die-release condition | Sample or test-method difference | Do not cut water automatically |
| Irregular kibble shape | Piece dimensions vary with feeder or pressure trace | Inspect dosing, slurry mixing, preconditioning, and die flow | Cutter alignment or die wear | Do not change barrel temperature from appearance alone |
| Ragged cut surface | Cutter speed or blade condition changed while strand flow stayed stable | Inspect blade condition, clearance, cutter synchronization, and strand temperature | Weak dough structure or die wear | Do not compensate only with more cook |
| Surface cracks or blisters | Defect tracks product moisture, piece size, or dryer zone | Compare die-exit state with early drying rate and cross-bed location | Internal cell weakness at die release | Do not raise dryer temperature before mapping the defect |
| Outlet moisture drifts high | Air condition, bed depth, residence time, or incoming load moved | Check the full dryer balance and incoming product state | Sampling location or instrument equilibration | Do not assume temperature is the only control |
| Outlet moisture is nonuniform | Cross-bed samples show a repeatable position pattern | Inspect airflow distribution, bed loading, product spread, and agitation | Mixed incoming kibble sizes or densities | Do not lower the average target to hide a wet zone |
| Water activity differs at similar moisture | Formula, sample temperature, or equilibration changed | Verify formula identity, sample preparation, temperature, and calibrated method | True water-binding difference | Do not convert moisture directly into water activity |
| Coating pickup is uneven | Surface oil or palatant varies with product temperature or mixer loading | Check cooling handoff, spray distribution, flow, and mixing time | Porosity or surface-area shift from extrusion | Do not increase dose before checking distribution |
| Breakage increases | Fines rise after one conveyor, cooler, coater, or package transfer | Locate the first transfer where the fines increase | Low structural strength created at extrusion or drying | Do not blame handling until pre-transfer strength is measured |
| Palatability result declines | Coating, oxidation, texture, or formula evidence changed | Verify lot identity, coating distribution, storage, and test design | Animal-panel variation or upstream formula change | Do not infer one process root cause from one preference result |
Do
Freeze the event window, retain the recipe and lot identity, and collect a second signal before adjustment. Change one controlled factor only when the evidence and plant procedure support it.
Do not
Use a single symptom as a root-cause verdict. Do not copy a published study treatment into production without trials, validation, and the facility’s authorization process.
What to Measure Across a Dry Kibble Extrusion Line
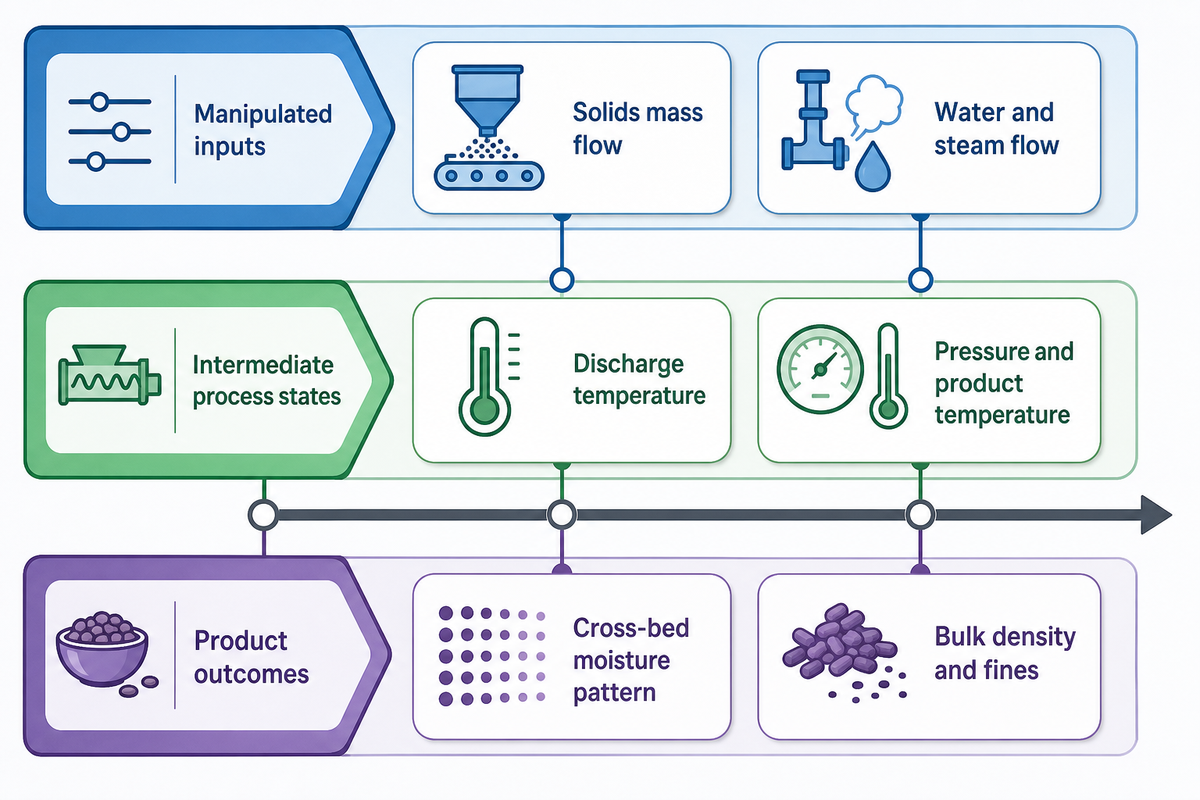
In turn, a useful measurement plan follows material through time. It distinguishes what the operator sets, what state the process reaches, and what the product demonstrates. Use the Stage-Linked Measurement Matrix below as a worksheet for designing that record. Units and sampling frequency must fit the plant’s instruments, product, validated methods, and control plan.
| Stage | Signal | Typical unit | Sampling point | Event trigger | Question answered |
|---|---|---|---|---|---|
| Ingredient preparation | Particle-size distribution | µm or sieve fraction | After grinding, before mixing | New lot, screen change, or flow change | Did hydration and packing potential change? |
| Batching and mixing | Recipe and lot identity | Batch ID | Mixer discharge | Every batch or changeover | Which material actually entered the line? |
| Feeding | Solids mass flow | kg/h | Feeder discharge | Rate deviation or surging | Is barrel fill changing because feed is changing? |
| Preconditioning | Water and steam flow | kg/h | Addition lines | Valve movement or recipe change | What thermal and moisture input was delivered? |
| Preconditioning | Discharge temperature and moisture | °C and % | Conditioner outlet | Start-up, steady-state check, or disturbance | What dough state reached the barrel? |
| Extrusion | Motor load or torque | kW, A, or N·m | Drive control | Deviation or setpoint change | Did material resistance or mechanical work change? |
| Extrusion | Barrel and die temperature | °C | Named sensor zones | Deviation, rate change, or warm-up | Where did the thermal state change? |
| Die | Pressure and product temperature | bar or MPa; °C | Named die location and die exit | Shape, density, or flow disturbance | What state existed immediately before release? |
| Cutting | Cutter speed and piece dimensions | rpm; mm | Die face and timed sample | Length or edge defect | Is the defect flow-related or cutting-related? |
| Drying | Air state, residence time, and bed loading | °C, relative humidity, min, kg/m² | Named zones and conveyor | Moisture drift or new geometry | Did evaporative capacity or distribution change? |
| Dryer outlet | Cross-bed moisture pattern | % by validated method | Defined left-to-right positions | Routine map or nonuniformity | Does the average conceal a position effect? |
| Cooling and release | Product temperature, moisture, and water activity | °C, %, aw | After equilibration at defined points | Each validated lot or deviation | Are cooling, moisture, and water availability acceptable by separate criteria? |
| Coating | Liquid and dry-addition rate | kg/h or % | Application and finished sample | Formula or surface-condition change | Was the planned dose delivered and distributed? |
| Finished product | Bulk density, dimensions, fines, texture | kg/m³, mm, %, test-specific | Time-linked composite sample | Routine release or process event | Which process change reached the product? |
Without material identity, a timestamp is weak evidence; without a sampling point, a lab result is equally weak. Record sensor location, calibration status, method, sample temperature, formula, die, rate, and operator event. Then plot the first deviation rather than comparing only batch averages. Consistent quality requires evidence that remains comparable across lots, shifts, and changeovers.
This matrix supports extrusion-defect and remedy analysis, but it doesn’t replace the plant’s hazard analysis, sanitation program, environmental monitoring, preventive controls, or release authorization. Product-quality diagnosis and food-safety decisions have different evidence requirements.
When Formula Changes Move the Process Window
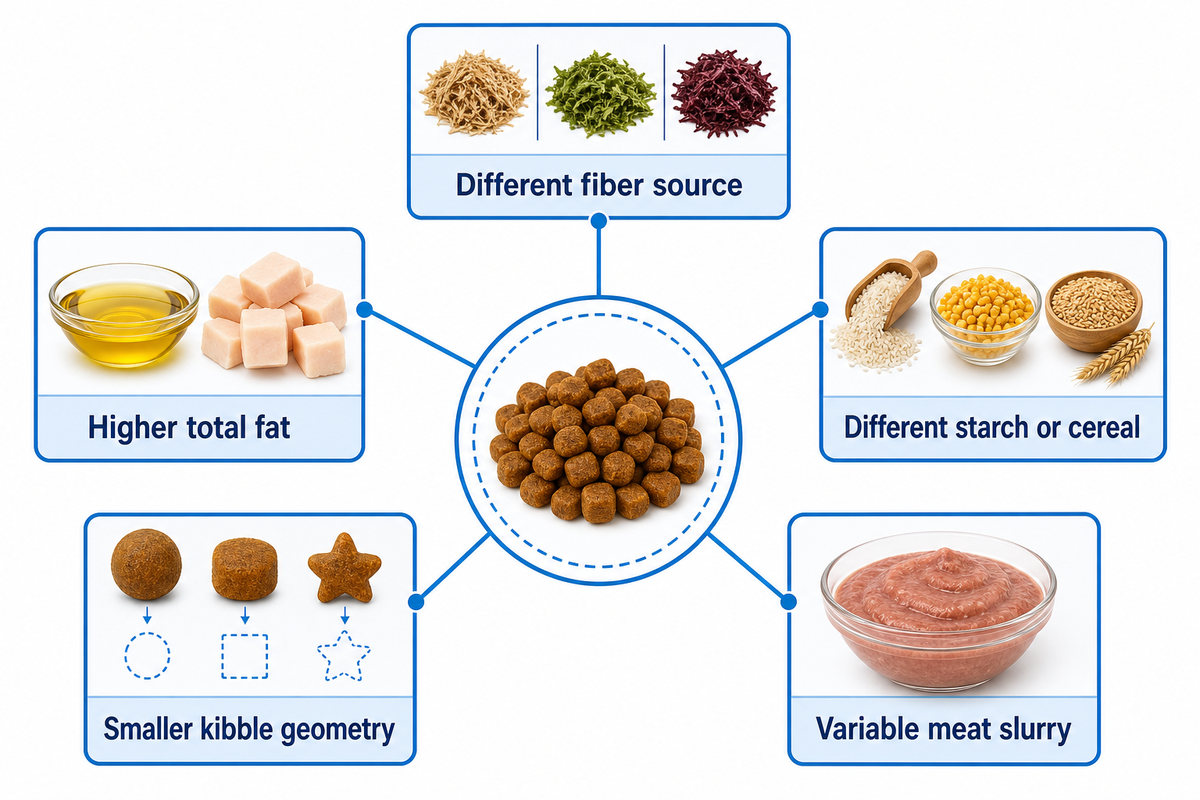
With that measurement record in place, each process window belongs to a formula, geometry, rate, and equipment state. “Same setpoints” isn’t a stable-control strategy after a meaningful formulation change. Protein source, cereal and starch type, fiber, fat, particle size, fresh-meat slurry, mineral load, and binder system can change hydration, viscosity, energy demand, expansion, cutting, drying, and coating.
| Change scenario | Likely process shift | Evidence to collect first | Transferability boundary |
|---|---|---|---|
| Higher or different fiber source | Water binding, viscosity, expansion, texture, and drying may move | Particle distribution, conditioner state, load, density, cross-bed moisture | Fiber type matters; inclusion alone is insufficient |
| Higher surface or total fat | Hydration, shear response, expansion, coating balance, and acceptance may move | Addition location, flow, load, expansion, surface condition | Pre-extrusion and post-extrusion fat have different roles |
| Different starch or cereal | Gelatinization, viscosity, expansion, and texture may move | Formula lot, energy response, die state, starch method, density | Botanical source and processing history matter |
| Smaller kibble geometry | Cutting frequency, surface-to-volume ratio, drying, and coating area may move | Piece dimensions, cutter trace, cross-bed moisture, pickup distribution | Shape and packing can offset simple size expectations |
| More variable meat slurry | Feed continuity, moisture distribution, load, pressure, and shape may move | Slurry uniformity, dosing, conditioner discharge, timed barrel traces | Composition and rheology must be measured, not guessed |
Controlled citrus-fiber research found formula-linked changes in processing and kibble characteristics. That supports the need to re-establish evidence after a change; it doesn’t provide a portable setpoint correction. Cat-food or high-protein recipes may respond differently from cereal-rich dog food. Corroborate before adjustment, and document which outcome the change is meant to restore. Easy cleaning is not proven by a process diagram; where dedicated washing or CIP is relevant, treat cleaning and CIP as a separate scope with its own access, residue, changeover, and validation evidence.
Integration and Utility Boundaries: Where Process Evidence Ends and Line Scoping Begins

Process evidence can describe material state, disturbance propagation, sampling, and control relationships. It can’t select food machinery or determine a complete production line from a generic article. Whether a food extruder machine uses single-screw extrusion or twin-screw extrusion affects the engineering discussion, but this guide doesn’t compare a single-screw extruder with a twin-screw extruder. Stage capacity, operating mode, utilities, layout, automation, cleaning, packaging, and interfaces are project-specific decisions.
Downstream equipment can constrain usable output when capacities or operating modes are mismatched, but it doesn’t always cap the line. An FAO small-feed-mill case deliberately matched a batch dryer to its extruder. The lesson is interface matching, not “the dryer is always the bottleneck.” Modular equipment can move an interface, but physics will not erase the mass and energy balance. Utility duty likewise depends on mass flow, material properties, temperature change, efficiency, and time; a generic steam number would hide the design basis.
| Process evidence can answer | Project-specific decision remains | Correct destination |
|---|---|---|
| Which signal changed first and how product state moved | Sensor package, control architecture, and alarm strategy | Configured engineering scope |
| How formula, geometry, and rate affect stage handoffs | Equipment sizing, operating schedule, and turndown | Capacity and trial discussion |
| Why drying and cooling must match the extrudate | Dryer zones, airflow system, utilities, and footprint | Line and site integration |
| Which samples support diagnosis | Validated quality limits, hazard controls, and acceptance tests | Plant quality and project protocols |
If your search began as a dry kibble extrusion line review and has moved from process diagnosis to an actual project, the next step is a configured scope. Shengtu’s dry kibble extrusion line page is the commercial destination for that discussion. This guide intentionally doesn’t repeat its models, modules, input checklist, quotation logic, or acceptance workflow.
Equipment troubleshooting does not replace food-safety governance. The FDA requires animal food to be safe, produced under sanitary conditions, free of harmful substances, and truthfully labeled. Facilities need their own applicable hazard analysis, validated preventive controls, monitoring, corrective action, verification, sanitation, environmental monitoring where required, and records.
Frequently Asked Questions
How does a pet food extruder work?
Conditioned meal enters a pet food extruder barrel, where screws mix, compress, heat, shear, and convey it toward a die while drive and thermal controls govern energy input and product-state measurements show the result.
Steam, water, mechanical work, temperature, pressure, and residence time change the dough state. At the die, pressure falls quickly, some moisture flashes, and the strand can expand. Cutter rotation sets the basic length before the pieces enter drying and cooling. Control should relate these inputs to the measured material state and finished kibble, rather than judge the process from one setpoint.
Can one production line produce different kinds of pet food?
Often yes, provided the configured equipment and validated operating windows cover the recipes, shapes, rates, and changeovers, and the plant can manage residue and contamination between runs.
One line shouldn’t be expected to run every product at one universal setting. Protein, starch, fiber, fat, particle size, diameter, coating target, and package schedule can change conditioning, screw response, die release, drying, cooling, and cleaning needs. Plant trials must establish whether the required windows overlap and whether each changeover can be controlled without destabilizing or contaminating the next run.
What are the key components of a pet food extruder?
Processing core equipment includes a controlled feeder, preconditioner, screw-and-barrel assembly, drive, thermal-control zones, die, and cutter, while sensors expose flow, load, pressure, temperature, and speed for process control.
Temperature, pressure, motor-load, flow, speed, and product-state measurements make the equipment observable. Beyond that core, a complete dry-kibble manufacturing line needs linked drying, cooling, coating, conveying, and packaging stages. Those stations aren’t parts of the extruder itself, but their handoffs affect usable output and finished quality. That boundary prevents an extruder reading from being mistaken for whole-line evidence.
What are the downsides of food extrusion?
Food extrusion exposes a formula to heat and shear, and its interacting variables can make poor diagnosis expensive because one change can shift density, moisture, texture, nutrient retention, or coating downstream.
An unstable process window can create density, shape, moisture, texture, nutrient-retention, or coating problems. Changing a setpoint to correct one symptom may create another defect downstream. Heat-sensitive nutrients and reactive compounds require suitable formulation, process validation, and testing. These are engineering and control limitations, not proof that extruded pet food is inherently unsuitable.
How does extruded kibble compare with kibble that is baked?
Extruded or baked kibble builds structure through different combinations of heat, moisture, mechanical work, and pressure, so trials must compare finished properties instead of relying on the process label alone.
Extrusion uses screw work and a rapid pressure release, so it can form expanded shapes continuously across a range of densities. Baked foods are formed and heated without the same die-release event, which can produce a different pore structure and texture. Neither route is automatically better for every recipe. Compare validated shape, bulk density, starch transformation, fat level, nutrient protection, moisture uniformity, throughput, changeover, coating, and animal response. Formulas developed for one route may need a different formulation or drying profile in the other. For a plant decision, use product trials and operating evidence rather than the marketing label alone.
Transparency note: This article synthesizes public research, regulatory guidance, extension material, association guidance, and clearly labeled trade examples. It doesn’t claim Shengtu plant-trial results or replace a customer’s recipe trials, validation, or food-safety plan.
References and Sources
- NC State Extension: The Role of Preconditioning in Food and Feed Extrusion
- Alvarenga et al.: Effects of Extrusion Processing on Kibble Characteristics and Starch Transformation
- Controlled dog-food study of thermal and mechanical energy during extrusion
- Formula and fiber effects during dog-food extrusion
- Review of modeling and product responses in food extrusion
- Review of dry pet-food palatability factors
- US FDA: Pet Food
- US FDA: Preventive Controls for Animal Food
- US FDA: Water Activity in Foods
- FEDIAF/UK Pet Food: Best Practice Guide for Manufacturing Safe Pet Foods
- PetfoodIndustry: Dryer Troubleshooting in Pet Food Processing
- PetfoodIndustry: Pet Food Extrusion Focuses on Precision
- FAO: Small Feed-Mill Process and Equipment Case
![F&V Freeze-Drying Line Process Guide [2026]](https://shengtumachinery.com/wp-content/uploads/2026/09/fv-freeze-drying-line-guide-featured-768x512.png)
![Beef/Lamb/Poultry Cutting Line Acceptance Guide [2026]](https://shengtumachinery.com/wp-content/uploads/2026/09/beef-lamb-poultry-cutting-line-guide-featured-768x512.png)





![F&V Freeze-Drying Line Process Guide [2026]](https://shengtumachinery.com/wp-content/uploads/2026/09/fv-freeze-drying-line-guide-featured-150x150.png)